
Why Traditional Tracking And Attribution Models is Killing your B2B Growth (And How to Solve It)
Explaining what attribution is and what attribution models can be used for in B2B companies is not a simple thing.
In fact, there's probably as many explanations as there's companies.
On top of this, attribution is a very different game in B2B than the more well known and simpler B2C space.
Through this post (based on real anonymous examples from our customers) we will try to explain what different attribution models mean for different companies.
Here's what you will get in this post about B2B attribution models:
Understand why B2B and B2C attribution is two very different things.
See 5 B2B companies revenue attribution models
Learn how different channels play different roles in revenue creation
How traditional tracking is disabling B2B growth

Searching on Google you will easily find posts and illustrations that happily simplify attribution.
But attribution is not simple.
To explain the topic to outsiders of the game, it might make sense with simplifications. For people who actually need to act on the signals that the data sends it’s not very helpful.
In fact, in B2B, what the free options like Google Analytics and Facebook Attribution offers is close to useless.
Sorry. Let us explain. It’s close to useless for a couple of reasons:
Time: There’s a long time from 1st visit to revenue in your CRM. The cookies expire long before it can send meaningful (revenue) information back.
Multiple stakeholders: One B2B account is often represented by multiple stakeholders. If you follow the person with the credit card you probably don’t see where the demand originated from, hence you can’t act and scale on that information.
Team effort: One sale, is the result of a team effort from your whole company. Only looking at marketing spend vs. revenue, does not make sense in B2B. Both customer success and sales also put in a lot of work to make a deal happen.
A new paradigm for B2B revenue data and attribution
So where do we go from here?
Knowing the reasons mentioned above, a lot of B2B companies don’t have a good idea of what actually drives their revenue. They are forced to shot-call on generic data. Their business is not set up to look at the specifics underneath the trunk.
Ie. a classic example would be marketing departments judged on amount of MQL’s/SQL’s per month/year.
Pure volume of leads are not really the right measure, is it?
The questions that probably should be asked are:
How much revenue can you prove that you were able to drive?
What were the specific elements and actions that impacted revenue?
Yes, shot-calling on generic data might get you through some years of growth.
But the time will come:
When all low hanging thoughts are gone, a recession strikes, your company goes from growth to profit focus etc. where you will have to be able to confidently show exactly which activities should we keep? Which exact activities should we scale?
Agree?
This level of granularity and qualified decision making data requires a new paradigm. A new quality level of B2B revenue analytics and tracking infrastructure.
You can not trust ad platforms; Google, Facebook, Linkedin or some fourth platform to tell you the truth about the impact of your ads.
You can not trust search engines; Google, Bing, Yahoo, Yandex, DuckDuckGO to tell you the truth about how search traffic impacts your business.
You need to start storing all the raw historic data yourself.
You need to start being able to gather, clean and making sense of your own data on.
Simultaneously, no, sorry, attribution is never going to be perfect. There will be bits and pieces you can’t discover and reflect digitally. That’s just how it is.
What attribution can do for you is to get you as close to the truth as a B2B data set can take you. In the end, you still need to add a pinch of gut feeling and thinking to your decision making.
The goal for doing your own attribution should be to develop a data set that reflects a full customer journey, that you trust enough to act on it. And when you do act, you most likely make more revenue.
The time is over for shot-calling based on generic data.
Before moving on to Attribution models you might want to familiarise yourself with what is attribution itself. You can do so by reading this article.
Attribution models
When your B2B data foundation is setup correctly, you can start to inspect your business from different angles through the lenses of different attribution models.
But Hey! What is an attribution model, really?
The attribution models instructs how you assign a value to each step of the customer journey.
Some classic attribution models are:
Last click (The standard setting in Google Analytics): Puts 100% value on the last action before a conversion happened.
First touch: Puts 100% value on the first step of the journey that led to a conversion.
Linear: If the customer journey have 10 steps, then each step is awarded 1/10 of the value creation
Position based: In this case you say some steps are more important than other. A well-known setting for this can be 40% for the first touch, 40% to the last touch and then 20% to all the touches in between.
Data-driven: If you have access to very large volumes of user journeys, it might be possible to apply some machine learning to identify which paths convert the best. This is rarely the case in B2B.
Custom: Perhaps you have your own idea of what matters and you can instruct attribution according to this.
All of them are interesting. None of them, though the data might be technical correct, should be regarded as the complete truth.
The attribution models represent different rays of light. These rays of light allow you to see your business from multiple perspectives. And these rays of light might also miss one, two or more areas of what’s actually going on.
So far, so good.
Now, if you’re in B2B, there’s an inconvenient truth, that we unfortunately need to tell you about.
The available tools typically follow users at the individual level. Hence most of the models are unable to make sense of what happens from a B2B perspective. Pain!
In B2B you want to understand what happens when one business is in the process of purchasing from another business.
This is the problem we are addressing for our customers at Dreamdata.
The ad providers does attribution based on their data. Dreamdata does attribution based on your data.
We gather, clean and sort B2B revenue data until we’re able to build a timeline of multiple individuals, who together represent a bigger timeline of:
When did you see a company the first time?
What were all the actions involved in the journey towards closing a deal?
What started the demand?
What closed the deal?
More on different revenue attribution models here.
Extracting value from B2B attribution models
Okay, we know, we have been going on and on about the importance of looking at business, not individuals, when you are doing B2B attribution.
Enough talk. More action and insights. Please.
There’s three areas to cover here.
For each of the three areas we will show you how 5 companies real (anonymous) data looks.
Revenue attribution: You can analyse your revenue as a whole. Of all the revenue you made for a given period, what channels and touches made it happen.
Comparing attribution models: Understand how each of your channels and source contributes to your company’s buyers journey.
Campaign level attribution: Understand how each campaign have different effect depending on first/last touch perspectives and how traditional tracking might prohibit B2B growth.
Revenue attribution
Here we go. The discipline of revenue attribution, in our perspective, divides all your tracked revenue, given a time period and attribution model, between the channels that made it happen.
Let’s do a simple revenue attribution example:
If your yearly revenue tracked revenue is $1,000,000 the revenue attribution will be something like this:
Direct: 40% = $400,000
Organic: 30% = $300,000
Paid: 20% = $200,000
Referral: 10% = $100,000
In it self, this does not tell any story besides what meets the eye.
However, if you know your business well, it’s a different story. You will be able to see whether the strategy set forth is working or not. You will get (data)facts as a measure of the things you continuously work on to improve that actually has an impact on your ability to generate revenue or not.
PREREQUISITE: YOU CAN ONLY ATTRIBUTE TO WHAT IS TRACKED. IF TRACKING IS NOT SETUP CORRECTLY, THE FOLLOWING ANALYSIS ARE BOUND TO FAIL AS WELL.
Now, let’s look at the revenue attribution model from 5 different companies:
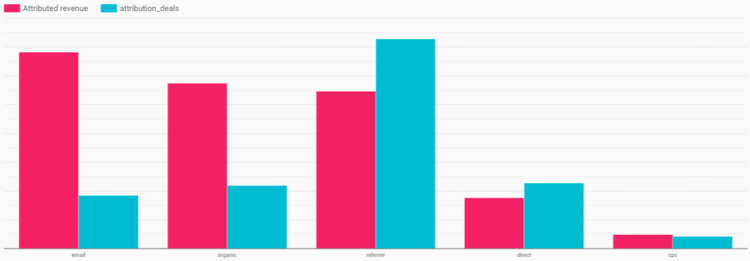
COMPANY 1 🍏

From the revenue attribution of Company 1, you get the impression that the traditional digital demand generation sources are not really playing a big role.
It looks to be brand / word-of-mouth channels, ie. direct and referer, that are bringing in the larger part of the revenue.
Tactically it could inform the company to start paying more attention to organic and paid as traction channels.
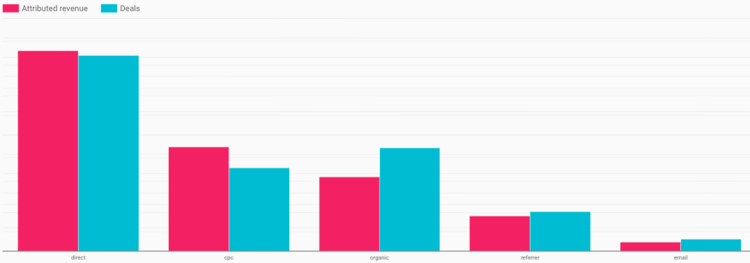
COMPANY 2 🍎
This is a “funny” case. In these digital times you often see that direct is bound to be the biggest revenue channel.
It’s not in this case. This company sells enterprise solutions. That probably means that the “handshake” happens elsewhere than on their website (direct). Perhaps physical, on the phone or through emails.
The paid channel is very small and looks to hold potential for growth.
COMPANY 3 🍊
This company looks to have a normal digital B2B split. Organic and Paid is being used and drives their share of revenue.
The reason why Direct is so big in this case can have a couple of reasons:
The sales people could be convincing customers offline and instructs them to pay on the website.
Revenue attributed to email looks unusual small. Perhaps they have some email flows that do not track correctly.
Find instructions on how to do B2B tracking correct here.
COMPANY 4 🍋
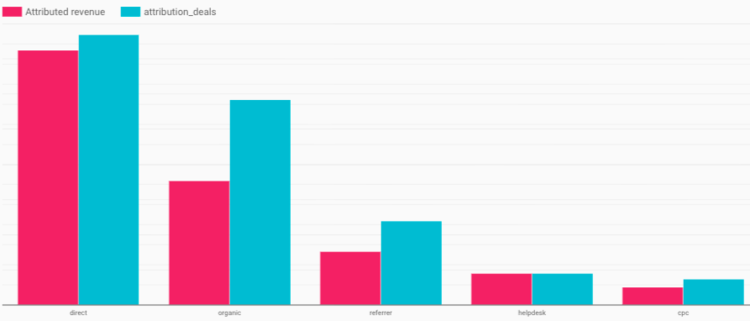
For this company organic traffic is driving a huge part of their revenue. Well done!
The size of the paid channel attribution looks like they could be under-investing here, as if they can sell through organic, they probably should be able to do so through paid as well.
An interesting insight here is the attribution to the help desk. Help desk and customer success are vital for B2B’s with complex products and are so often undervalued.
This company is tracking the performance of their customer success, so they strategically can decide whether it’s time to hire another salesperson or add another person to the customer success. One function enables another.
COMPANY 5 🍌

This last company has another different angle than the ones above. They are also tracking outbound calls to potential customers. This enables them to compare the revenue generated to the relatively costly affair of having people employed that does cold calling.
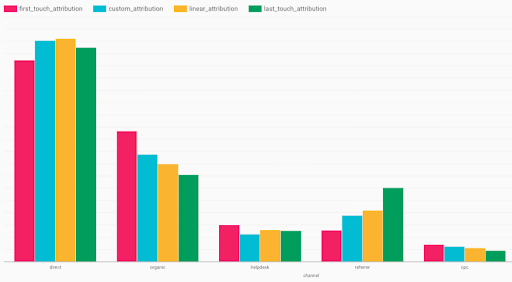
Comparing B2B attribution models
Understanding the overall revenue attribution is only the first step on the road to becoming truly data driven as a B2B company. The first step in moving from generic shot-calling to understanding the underlying specific events.
The next step is to understand the role each of the channels currently play. It’s quite different from company to company.
If you’re not aware about how each channel work for your company you risk shutting down what drives growth (first touch) and scale what only works after the whole demand has been built (last touch).
We will apply the same method above in order to understand different compositions of B2B attribution and demand generation.
COMPANY 1 🍏
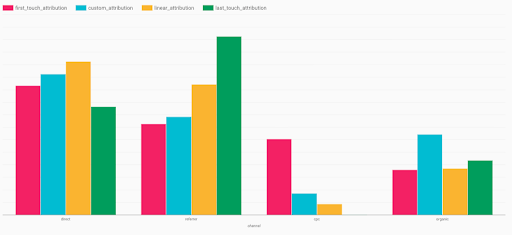
What springs to our eyes here is CPC (the paid channels) ability to start a lot of customer journeys, but it’s not the channel that closes them.
In 9 out of 10 B2B companies this would result in the paid channel being shut down. They would judge their spend in a last touch perspective. In that perspective, the spend is wasted as you can’t see any deals closing from the paid investment.
However, if you understand how first touch initiates buyers journeys, that are closed by the last touch of other channels, you might want to scale your spend instead.
Furthermore, that paid is not able to provide any last touch at all, could be because they are not running retargeting ads targeted to later stages of the buyer journey. They might want to look into setting that up.
COMPANY 2 🍎

This company looks to have some very well working email flows that both contributes to initiating customer journeys as well as closing them.
It’s a bit unusual that organic is doing well in a last touch perspective. This could actually be a sign that organic is underutilized as a way of creating new customer journeys.
The reason why organic looks to be contributing a lot of revenue in a last touch perspective is probably because the company have a good brand that makes people search for it, click and then complete orders on the website.
Lastly, again, paid for this B2B company only initiates journeys and do not start any. In the traditional tracking perspective you would have to shut the spend down as you would not be able to prove the value of the spend.
COMPANY 3 🍊

Some classic patterns to spot here. CPC and Organic, both contributes primarily as first touch sources, while Direct is the channel that performs well as the last touch before revenue is made.
Again, as mentioned above, their email channel looks either to be missing, like no flows etc., or the tracking of this channel is currently insufficient.
COMPANY 4 🍋
The pattern repeats for this company, just as we saw on the revenue attribution. Organic traffic is driving an impressive part of the company’s revenue.
But at this level, which is more granular, it becomes clearer that Organic plays a bigger role in a first touch perspective. This makes sense in B2B, as demand generation starts the journeys, and sales people closes the deals.
If this company, did not have these insights above, their Organic effort might be scaled down, as it would not be clear in a last touch perspective, just how much Organic actually contributes.
As with all other data points, it’s important to understand the outliers. For this one, referer looks a bit unusually large in a last touch perspective. Might be worth investigating why that is so. Is it a tracking problem or is it a source that can be scaled even more?
COMPANY 5 🍌

For this company, it’s very clear that they need to do stellar attribution. Why?
Look at the difference between first and last touch on all their demand generation channels: Call, CPC and Organic.
If they could not connect their activities from first touch to revenue with months between, they would have to shut down all demand generation. Instead, now they can scale, as they know which role each channel plays in growing their business.
The Direct channel just act as the cashier. The magic happens in all the other channels.
Campaign level B2B attribution
We’re getting closer to understanding what drives revenue. But, we’re not completely there yet.
We can go one step deeper. We can examine the specifics of each channel.
From the above, we have learned that each channel contributes differently to the companies revenue. Nice. That helps making strategic choices about which channels to bet on and pour salaries and spend into.
But to get even more tactical and tangible we have to understand all actions in this first touch vs. last touch perspective.
Some actions we take to start journeys. Some action we take to close journeys. One can’t do without the other.
In the graph below, we’re inspecting a customer’s ads performance. What you can see is that different ads do different stuff well.
The ones that the ad platforms traditionally can help you understand are the ones that do well in a last touch perspective. Someone clicked here and now they bought your product. That’s fine and gives some comfort. In reality, it’s not that useful if you want to grow your B2B.
Demand does not start, when the guy with the credit card buys.
The first touch very often starts when someone from the company comes across your ad or finds you through search - And that’s the activities you should be looking to scale, not to shut down due to lack of data and tracking.
If you look at the case below 9 out of 15 ad campaigns would have to be shot down, if only measured in a last touch perspective.


Concluding remarks about B2B attribution models
If there’s a few points that we really can’t stress enough about B2B attribution and B2B growth it’s:
B2B growth is different than B2C.
Challenges are multiplied by the long buyers journeys and the multiple stakeholders that are involved.
Each B2B need to assume the driver's seat of their own data.
Collect your own raw, historic data and store it in databases, so you can make sense of it, as questions occur.
Go from generic to specific data.
Each channel has a different function. Each channel and campaign contributes differently to revenue creation. Growth comes from understanding the granularity beneath what meets the eye and traditional tracking.
Please do share your thoughts with us about the above.