
Time to Revenue: The One KPI You Should Strive to Really Know
It’s an eternal discussion. What KPI should your B2B focus on? There are very likely as many opinions as people to ask.
So making the claim of a single B2B North Star KPI is surely a fool’s errand that risks ridicule, right?
Well, not if you have the data to back the claim.
So, foolhardy or not, in this post, we will be showing you why Time to Revenue is the one KPI you should strive to really know.
Here’s what you’ll get from this post:
Learn to define B2B Time to Revenue
Why Time to Revenue is Critical for a B2B
Understand the complexity of tracking B2B growth
See a real Time to Revenue graph
The technical foundation for extracting Time to Revenue
The one KPI that everybody involved in B2B growth should aim to know is:
Time to Revenue
How long does it take from the first time somebody from a potential account visits your website until the account is closed as won?
We have not yet come across a single company who can answer this question instantly and with full confidence.
This goes even for tremendously smart people, with a flair for B2B growth. They just don’t know.
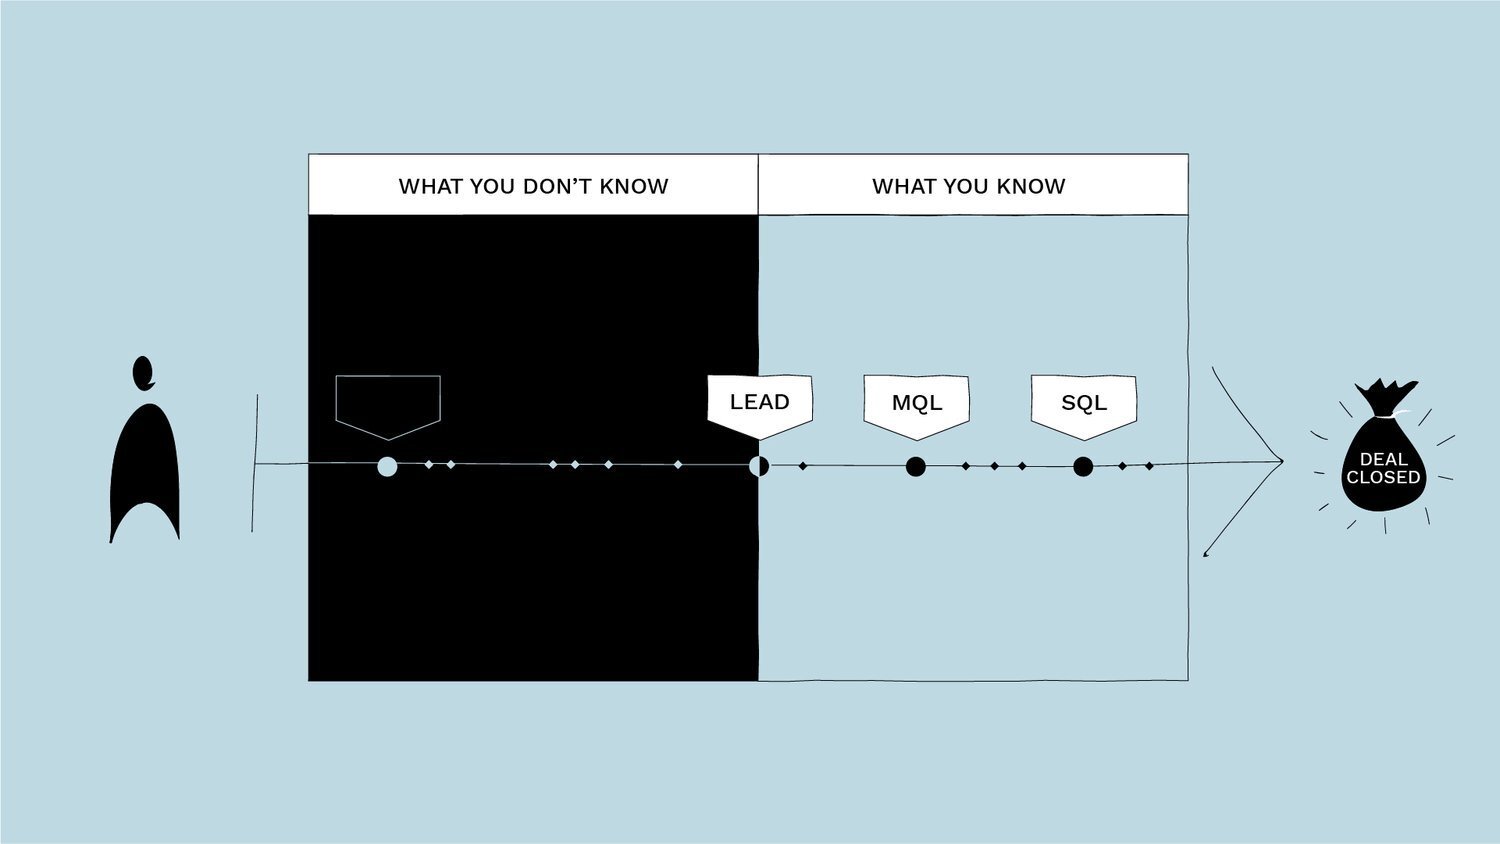
Yes, they will know from whenever the lead entered the sales pipeline. That’s easy.
But they don’t know where the original demand of the account started.
Learn your Time to Revenue now
with Dreamdata

Time to Revenue - Why you should care
There are a ton of reasons why you should care about truly knowing the Time to Revenue for all your accounts.
Here are some of the most important:
Growth activities:
In today's B2B marketing world too many ideas are killed. Their effect will impact long term, but they are judged on a month to month basis.
In the example below you will see that the company’s average customer journey is +200 days.
It’s simply beyond Google’s and Facebook’s tracking abilities to understand B2B value. Hence why if that’s all the tracking you do, you can’t know whether your growth activities are working or not.
Paying the bills:
In B2B revenue isn’t normally generated instantly. It takes time. It takes planning. It takes execution.
You need to be able to understand how your expenses - salary, rent and other essential bills - you’re making now, comes back in terms of revenue.
Predicting revenue and budgets:
The number of startups that have failed to ‘make it’ because of not hitting their budgets are too many to count.
When you know your average Time to Revenue from the get-go, you will know whether the numbers you’ve set as targets are actually possible to hit.
If your average sales cycle is +365 days, then at the end of year 1, it’s already too late to hit year 2’s budget, unless the leads are already in the pipeline, right?
Experimentation:
Knowing the average account journey gives a benchmark for trying to accelerate the journey.
Should you send more emails? Change the content of your automation? Run more ads? Pick up the phone twice as many times?
No benchmark, no improvement.
Conversion types:
What conversion types are the best conversion types for your business?
Which ones convert faster?
Which ones are the most valuable?
Which one should you try to optimize for going forward?
If you don’t know your Time to Revenue, you can’t provide a qualified reply to these questions.
Improve sales:
Large accounts take a long time to won. But how long exactly? Are they worth chasing?
Account managers might have rules about moving leads to closed lost after +100 days. But what if the average Time to Revenue for a large deal is 131 days as the example we will show below. Then you better keep trying to close the deal!
Knowing Time to Revenue will give you a better understanding of what moves the needle in your B2B. Everything revolves around it. Really.
You simply can’t judge activities on a monthly basis, if results are to be seen yearly. Things take time in B2B.
If you can connect the dots between the first demand-generating touches and much later revenue, you have a significant edge on your competitors.
Read more on B2B go-to-market benchmarks here.
The B2B tracking problem
The bad news is that Time to Revenue data takes work to capture and understand.
The good news is that this post will tell you how to get there.
Tracking B2C e-commerce is one thing. A customer clicks an ad and visits a website from a phone and perhaps comes back to buy from a computer. There’s some complexity to it, right? Especially, if you’re only doing cookie-based tracking through Google Analytics. As this data will not reveal the whole truth about what’s going on.
The gap can be somewhat overcome if you’re using Facebook Ads and Facebook Attribution. With most people being signed into Facebook on all the devices they use, these are a powerful tool. However, they are limited to covering “simple” B2C e-commerce tracking (people-based tracking). Which, although probably sufficient in the B2C context, is woefully inadequate in the B2B space.
B2B transactions are a completely different ball game. Tracking what happens when one company is moving towards buying a product or a service from another company is complex.
There are way more ingredients thrown into the mix. For instance:
Make sure you have what you need to discover the length of your customer journey
Revenue:
Most B2Bs do not have a cash register. There’s typically no way to complete a transaction on their websites.
This means there’s no revenue component to send back to the ad platforms and spend money on ad campaigns that drive revenue.
Time:
B2B deals take anywhere between 6, 12 or even more months. Getting from preliminary research, to budget availability, to the agreement of terms, takes a while.
In these cycles, some activities start the customer journeys (e.g. paid ads) and others close the deals (e.g. sales meet). This makes it a lot harder to connect the dots.
Stakeholders:
Demand does not start when a transaction is completed.
In most B2B transactions multiple stakeholders will be involved.
From our everyday experience at Dreamdata, to close a deal we often need to work with a bunch of people. A marketing specialist wants to know if the ads work. A VP wants to know which channels drive growth. The CEO and CFO wants to allocate budget to the utmost effectiveness. All of them need to say yes before we can send our order form.
Sound familiar?
Team:
Traditionally attribution is de facto understood as marketing attribution. What are marketing activities worth?
It’s a siloed way of thinking that does not reflect what moves the needle in B2B.
Yes, marketing initiates a lot of journeys, but customer success needs to reply to a ton of Q&As, and let’s not forget sales people, who need to wiggle and wrestle their way to deals.
Knowing this, does it really make sense to only appreciate marketing efforts when judging B2B growth? No, obviously not.
Check out this post on revenue attribution modelling.
In all this complexity, understanding Time to Revenue per deal might seem like a stretch. Impossible even.
You might even feel like giving up on B2B tracking and ignoring the Time to Revenue metric. Don’t.
Not only is tracking B2B customer journey data possible, but we’ve got the tool to do just that.
Let’s look at a concrete example.
Inspecting a Time to Revenue graph
Below you will find a Time to Revenue-graph.
The data is from a Dreamdata B2B customer, who's using Dreamdata to gather and make sense of their Time to Revenue data.
What Time to Revenue measures:
Time from 1st visit (Ads, organic, direct etc.) from individual until the deal is closed as won.

So what can we observe from the graph?
This B2B company has collected data for 1,5 years, but it seems that they are still unable to see what an average customer journey is for them. Time to Revenue, from first touch (ad click, organic visit etc.) to deal closure, keeps rising.
This is because Time to Revenue is an evolving KPI.
When new data points are collected, the model is adjusted. It’s alive, so to speak.
If a touchpoint is discovered which took place before the one originally thought of as the first touchpoint, the algorithm corrects the history. Per the graph above, it keeps trending upwards.
What the person hungry for growth will/should now be thinking is:
“Ok. Now, we’ve sorted all the journeys. We know where they started. We know when they closed. Can we look at where the fastest journeys come from? I want to do more of those”.
Yes, you can. Here’s the data related to the above customer journeys:

And so you can keep asking relevant questions:
“Okay, some channels are faster than others. But what are the average deal values of each channel? Perhaps I’m okay with it being slower, if the average value is higher.”
“Say, if the organic channel has a higher average deal size, which exact URLs are starting these journeys. Let’s produce more of this type of content.”
“Or, do certain ad campaigns have particular fast turnaround time? I want to do more of those.”
“And what about the account size, does that affect the Time to Revenue as well?”
For the two accounts shown below, it definitely does.

Get the right tracking, data collection and data models in place. Then you can answer these kinds of B2B attribution and revenue analytics questions.
Want to know how to do this? Keep reading. The technical recipe is coming up.
The technical foundation
Getting to the Time to Revenue KPI comes down to one thing: Data.
The first port of call is making relevant data available and starting to store it. Only then can it be analysed.
But, what is relevant data?

The rule of thumb in your company should be to try and make sure that everybody’s work generates digital reflections.
If your sales and support people currently pick up a random phone and call customers, stop that. Start using calling software that generates a digital touchpoint every time the phone is picked up.
If your support tickets are handled in gmail, switch to a support system that’s able to structure and categories the conversations.
If you only run offline ads… you should really start spending money on digital ads already! :)
In a perfect world the answer to what data you need is: Every single touch point that affected the deal. Unfortunately, that’s never going to happen.
What you can do is collect and store your 1st party data to make your own analysis of what’s going on in your B2B:
Database:
The first step you need to take is to establish a database. Your own database.
This is to be the container where you’ll pipe all the data you are generating in all the digital tools you use.
Marketing:
Ads: Most B2Bs rely on Facebook, Google and Linkedin, to store their ad data forever. Problem is, they don’t. Within some months they will start deleting this critical information about what generates your B2B demand.
Organic search: Google's Search Console can be a pot of gold if you’re able to inspect the data. Make sure to pipe this data into your database as well.
Events, meetups and webinars: A lot of B2B deals are still triggered from physical meetings. It can be hard to exactly estimate the value of these physical interactions, but it’s definitely possible to apply attribution to them. You just need to be disciplined about the data collection. If nothing else, write these things down in a sheet for later use.
Where did you meet the lead? Who did you meet? Which company do they represent? When did you meet them?
Automations: If you have automated emails through a tool, make sure all the data generated by the tool is stored in the database as well.
Customer Success:
In B2B these are the frontline employees that deal with all the day to day questions coming from the leads lurking around your business. You should know:
Which leads are asking questions? What articles are they reading? Are they expressing a desire to purchase?
By using a customer success platform like Intercom or Zendesk you will be able to take this information out of the tool. This means you can start to attribute revenue to your customer success team and not just proxies like a better Net Promoter Score.
Sales:
Account executives, Key Account Managers and the likes can sometimes be regarded as magicians and vital deal makers.
It’s certainly true that many in sales are great talkers and convincers. However for most sales people activities like calls, mails, texting are what makes the difference between a good sales person and one that’s mediocre.
By implementing calling software or outreach tools, you are able to measure the activities of sales people and attribute revenue to their actions.
CRM:
A disciplined use of a CRM system is critical to running a successful B2B.
It ensures that employees don’t make a mess of the interaction with your customers.
It will help you get some predictability into your revenue planning.
Most importantly it will help you sort individuals according to what company they belong to, which is critical when trying to do B2B attribution.
User data:
For a long time now Google Analytics has been the most widely used website tracking tool. For a while it remained the best option for tracking what takes place on your website.
But times have changed. For one thing, today's complexity with multiple devices per user is something Google Analytics still hasn't managed to grasp well.
More importantly, it is not easy to take all the ID’s (known as unknown users) and their behavior out of Google Analytics. That’s a critical flaw.
Being able to store user data is an absolute critical component for glueing ie. ad buying together with newsletter signups, that at a later point end up becoming accounts that are closed as won in your CRM.
Our suggestion would be that you start to track users through Segment.com.
More information on customer data tracking here.
See your Time to Revenue metric now
Sorting individuals to B2B accounts to understand Time to Revenue
With all the data collected and cleaned the next step is to sort it by accounts/companies.
If you are a B2B and are tracking the actions of individuals, you’re probably doing it wrong.
Check out how you can easily get your revenue data with Revenue Analytics.

In B2B buying processes the torch switches multiple times.
When you sell B2B, you should think of attribution as following a company’s journey towards purchase.
This means knowing when you interact the company for the first time through to the closed deal. From the first individual to all the stakeholders involved in the buying process.
What are all the (digitally measurable) actions that the company has taken on the road to becoming your customer?
A solution to do this sorting can look like this:
Everyone who comes to your website is given an anonymous ID.
This is set both in the browser and local storage to make sure it’s not lost.
We use Segment.com to do this.
The anonymous journey is stored in a database, awaiting a later association to a company.
When the anonymous ID at some point identifies themselves (an ID event), the user is associated to a company.
The ID event could be upon;
signing up to a newsletter,
purchasing a product
or perhaps logging into a service, both as the first from a company or by invite from a colleague post-purchase.
In some cases IP lookup through services like leadfeeder, ocean.io, clearbit etc. can make sense.
As the users are associated to companies, we start to join the individual journeys, to one joined company journey, to tell a story about key events:
When did we see the company appear anonymous on our website the first time?
When did the company identify initially?
When did they start paying for the first time?
What have lifetime revenue have made from this company?
When did the company end up churning?
Doing all this will enable you to connect the full B2B customer journey, including being able to understand Time to Revenue from the very first visit to your website to when the average deal is closed as won.
Check out this post on why Google Analytics doesn’t work in the B2B setting.
Concluding remarks
Time to Revenue is a critical KPI for B2Bs. Demand and Sales do not happen over night.
You need to plan ahead. You need to do stellar execution through out the company.
Marketing should start the journeys. Customer success should give qualified answers to product questions. And
Sales should put in the work to iron the last details.
All of it takes time, and the right tool.
If you don’t know your Time to Revenue you don’t yet know what success looks like.