
Cohort Analysis for B2B SaaS: A Practical Guide
Library > Cohort Analysis for B2B SaaS
Written by Stephanie Dean
Published on 29 October 2026
What is cohort analysis?
Cohort analysis follows a defined group over time, such as companies that started a trial in January or became paying customers in February. It helps B2B marketers see whether the customers they attract activate, stay, and grow after the initial conversion.
The starting event is the cohort anchor. Choose it to match the question, then compare groups at the same elapsed time from that event. A customer acquired last month has not had the same opportunity to renew or expand as one acquired last year.
To evaluate onboarding, start with everyone who entered the relevant onboarding experience. Restricting the group to people who completed it would leave out the people the experience failed to help.
To evaluate retention among paying customers, start with the first paid subscription or another clearly defined commercial event. This answers what happens after acquisition, not how efficiently prospects become customers.
Choose the unit as carefully as the start date. Users, workspaces, subscriptions, and companies can produce different answers. Company-level retention is useful for customer relationships; user-level retention is useful for product engagement.
For marketing, cohort analysis adds a longer view to acquisition reporting. A channel with inexpensive signups may produce customers who leave quickly, while another may attract fewer customers who stay and expand.
Build a retention view with clear definitions
Decide what “retained” means before calculating a percentage. A company with a paid subscription may have no recent product use. That company can count as commercially retained while appearing inactive in a usage report.
The information behind a useful cohort
A stable identifier: The company, subscription, workspace, or person you are following.
An entry event and timestamp: The event that assigns the entity to the cohort.
An entry period: For example, the month of first paid subscription.
A reporting cutoff: The latest date for which the relevant data is complete.
Elapsed time: Days or months since entry, with a consistent definition across cohorts.
A retention condition: For example, an ongoing paid customer relationship, distinct from a product activity threshold.
Relevant starting characteristics: Such as plan, company size, or acquisition source, recorded consistently at cohort entry.
An illustrative customer retention calculation
Start with 100 companies that became paying customers in January. Keep those original 100 in the cohort even when some later cancel.
Choose comparable checkpoints. For this example, measure each company three and six months after its own paid start date.
At the three-month checkpoint, 90 companies remain paying customers. At six months, 82 remain. Assume none canceled and later returned in this example.
The resulting retention measures are:
Starting cohort: 100 paying companies.
Three-month customer retention: 90 ÷ 100 × 100 = 90%.
Six-month customer retention: 82 ÷ 100 × 100 = 82%.
Customer retention, often called logo retention, counts customer relationships. A usage-retention measure would require a separate definition, such as completing a meaningful action during a given interval.
Keep canceled customers in the original denominator. Define how returning customers are handled: retained at a checkpoint and continuously retained since entry are different measures.
A cohort table normally places entry periods in rows and elapsed periods in columns. Leave cells unfilled when a cohort has not reached that age. An unobserved six-month result is not zero retention.
Compare customer retention with revenue retention
Customer counts show how many relationships remain. Revenue retention shows how the recurring value of those same relationships changes. Expansion at a few customers can offset losses elsewhere, so the two measures can tell different stories.
For SaaS, use a consistent recurring revenue basis such as monthly recurring revenue (MRR). MRR normalizes subscription value to a month; it is not the same as cash collected or accounting revenue recognized during that month.
Gross and net revenue retention
Gross revenue retention (GRR) measures retained recurring revenue after churn and contraction, excluding expansion. It cannot exceed 100% under that definition.
Net revenue retention (NRR) includes expansion from the starting customer group. It can exceed 100% when growth within that group outweighs losses.
Neither measure includes new customers acquired outside the starting group. Keep customer retention alongside GRR and NRR so expansion does not hide a shrinking customer base.
A worked revenue example
Suppose a cohort starts with $100,000 in MRR. Over the period, it loses $10,000 to customer churn and $5,000 to contraction, while other customers add $20,000 through expansion.
The same cohort ends with $105,000 in MRR: $100,000 − $10,000 − $5,000 + $20,000.
Using the original $100,000 as the denominator:
GRR = ($100,000 − $10,000 − $5,000) ÷ $100,000 × 100 = 85%.
NRR = $105,000 ÷ $100,000 × 100 = 105%.
Interpretation: Expansion more than offsets the losses, but the cohort still lost 15% of its starting recurring revenue before expansion. Investigate churn and contraction rather than treating 105% NRR as the whole story.
This example has no reactivations or other revenue adjustments. In your reporting, define how returning customers, currency changes, and plan changes are treated. Apply those rules consistently instead of mixing metrics with different scopes.
In a cohort heatmap, compare the same elapsed-age column to see whether newer cohorts perform differently. In a table with chronological entry months down the rows and elapsed months across columns, a diagonal can represent the same calendar month affecting several cohorts. That may point to a shared event rather than a problem unique to one cohort.
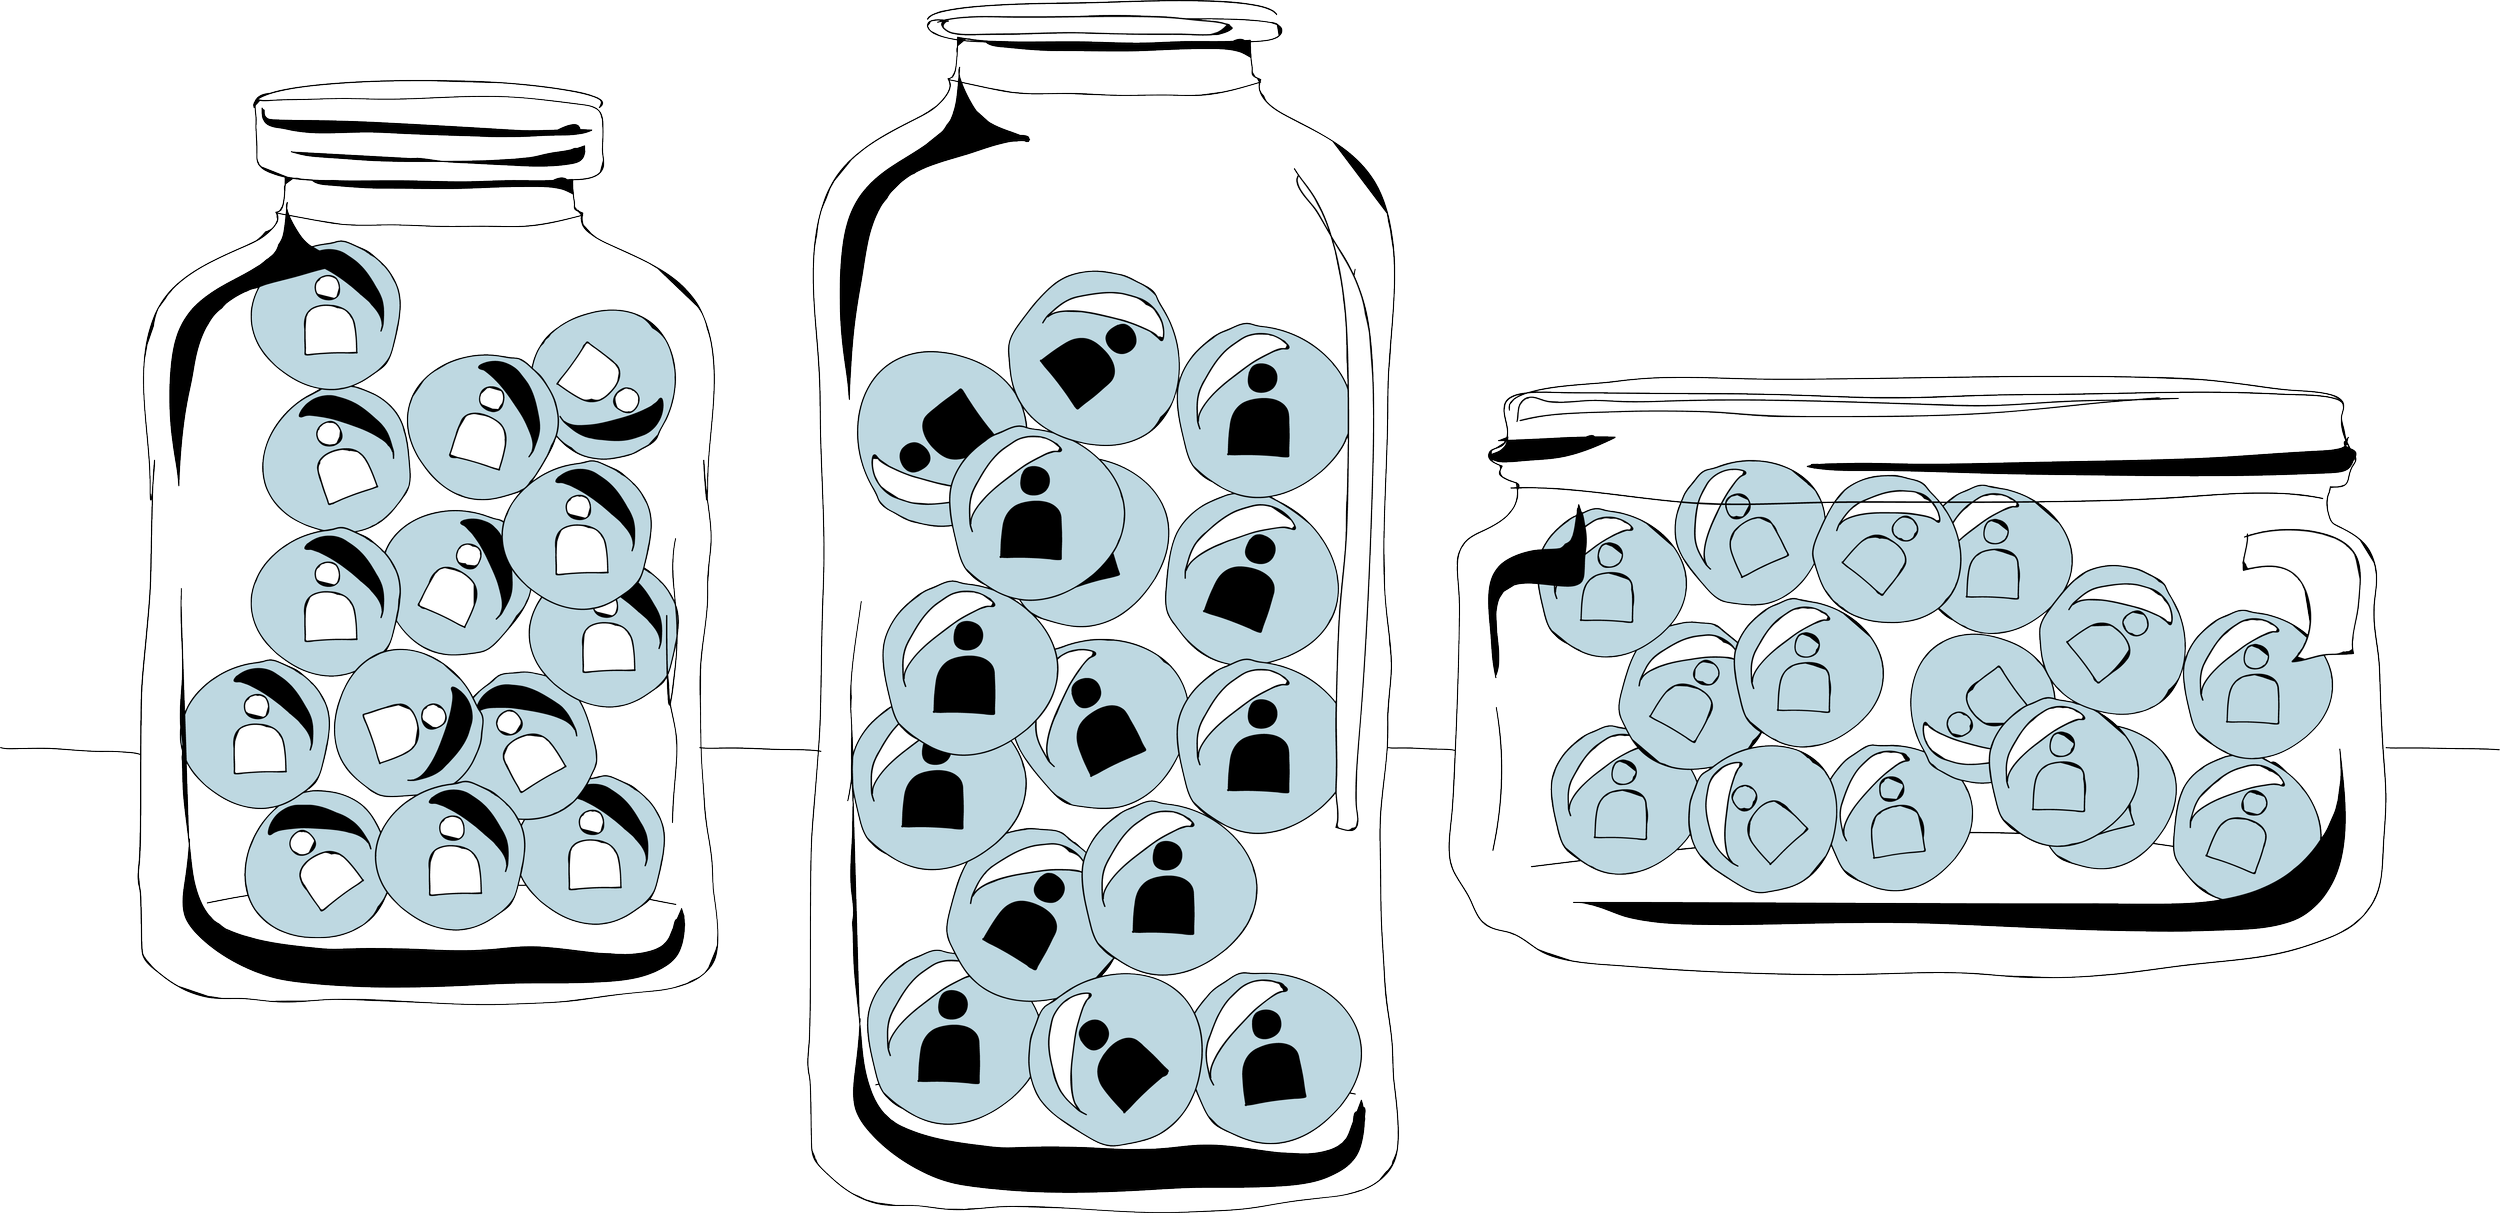
Use segmentation to investigate marketing quality
Once the baseline is reliable, compare groups that help answer a business question. Show the underlying counts: a retention rate based on five customers is more sensitive to one cancellation than a rate based on 500.
Use acquisition segments to investigate which audiences and offers produce durable customer relationships. Use product and onboarding segments to investigate what happens after those customers arrive.
Useful comparisons and their limits
Acquisition source: Apply a consistent source definition. Compare retention at the same age and include acquisition cost when considering whether to scale a channel.
Customer fit: Compare industries, company sizes, or other parts of your ideal customer profile. A channel difference may reflect a different mix of customers.
Early onboarding behavior: Define a fixed window, such as completion within the first 30 days, and compare subsequent outcomes among customers observable through that window. Report early losses separately.
Feature adoption: Use a clear observation window and later outcome period. Customers who survive longer have more opportunity to adopt features, so “ever adopted” can make a feature look more important than the evidence supports.
These comparisons identify patterns to investigate. They do not establish that onboarding completion or feature adoption caused retention. Customer needs, resources, and motivation may influence both behavior and outcomes.
To test an onboarding change, compare all eligible entrants under the old and new experiences with equal follow-up time, and use a controlled experiment where practical. Comparing only successful completers would miss part of the effect you want to understand.
B2B attribution can add a view of recorded touchpoints across the journey. Keep attributed credit separate from cohort membership: a customer can interact with several channels, so channel-exposed cohorts may overlap and should not be added together as unique customers.
Turn the pattern into an investment decision
Cohort analysis is most useful when it changes a specific decision about audience, messaging, onboarding, or customer support. Start with what changed and inspect the accounts behind the result before deciding on a response.
What to review together
Shared definitions: Marketing, product, customer success, and finance should know which entities, starting events, and outcomes the report uses.
A compact view of the customer path:
Activation and time to value among eligible starters.
Customer retention at comparable ages, including original cohort sizes.
GRR and NRR, with churn, contraction, and expansion shown separately.
Acquisition cost recovery, using the relevant acquisition costs and cumulative gross profit from the cohort.
Context: Note campaign, pricing, onboarding, product, and market changes that might explain differences. A coinciding change is a hypothesis to investigate.
Responsibility: Assign someone to examine a meaningful change and agree on what evidence would justify an intervention.
For example, a weaker cohort can lead to different next steps depending on where the customer experience breaks down:
Low activation among new signups: Investigate audience fit, the acquisition promise, and onboarding friction, including people who never completed onboarding.
Lower GRR among paying customers: Examine cancellation and downgrade reasons, product use, and customer support context. The metric locates a problem but does not name its cause.
Slower acquisition cost recovery: Compare acquisition spending, customer mix, gross margin, retention, and expansion before changing the media budget.
Dreamdata’s account-based data model connects recorded contact activity with companies and commercial outcomes. Customer Journeys helps you inspect the marketing and sales activity behind individual accounts, adding context to the cohort patterns you see.
Use cohort analysis alongside customer lifetime value and marketing ROI analysis to decide where further investment is justified. Start with comparable groups and a clear outcome, then follow the evidence into the customer experience that produced it.