
ANALYTICS HUB
Answer any question on marketing's impact instantly
Dreamdata shows you how B2B marketing actually drives revenue, across the most complete customer journey you've ever had. Build custom reports and dashboards with numbers that always trace back to the source, without waiting on Ops.
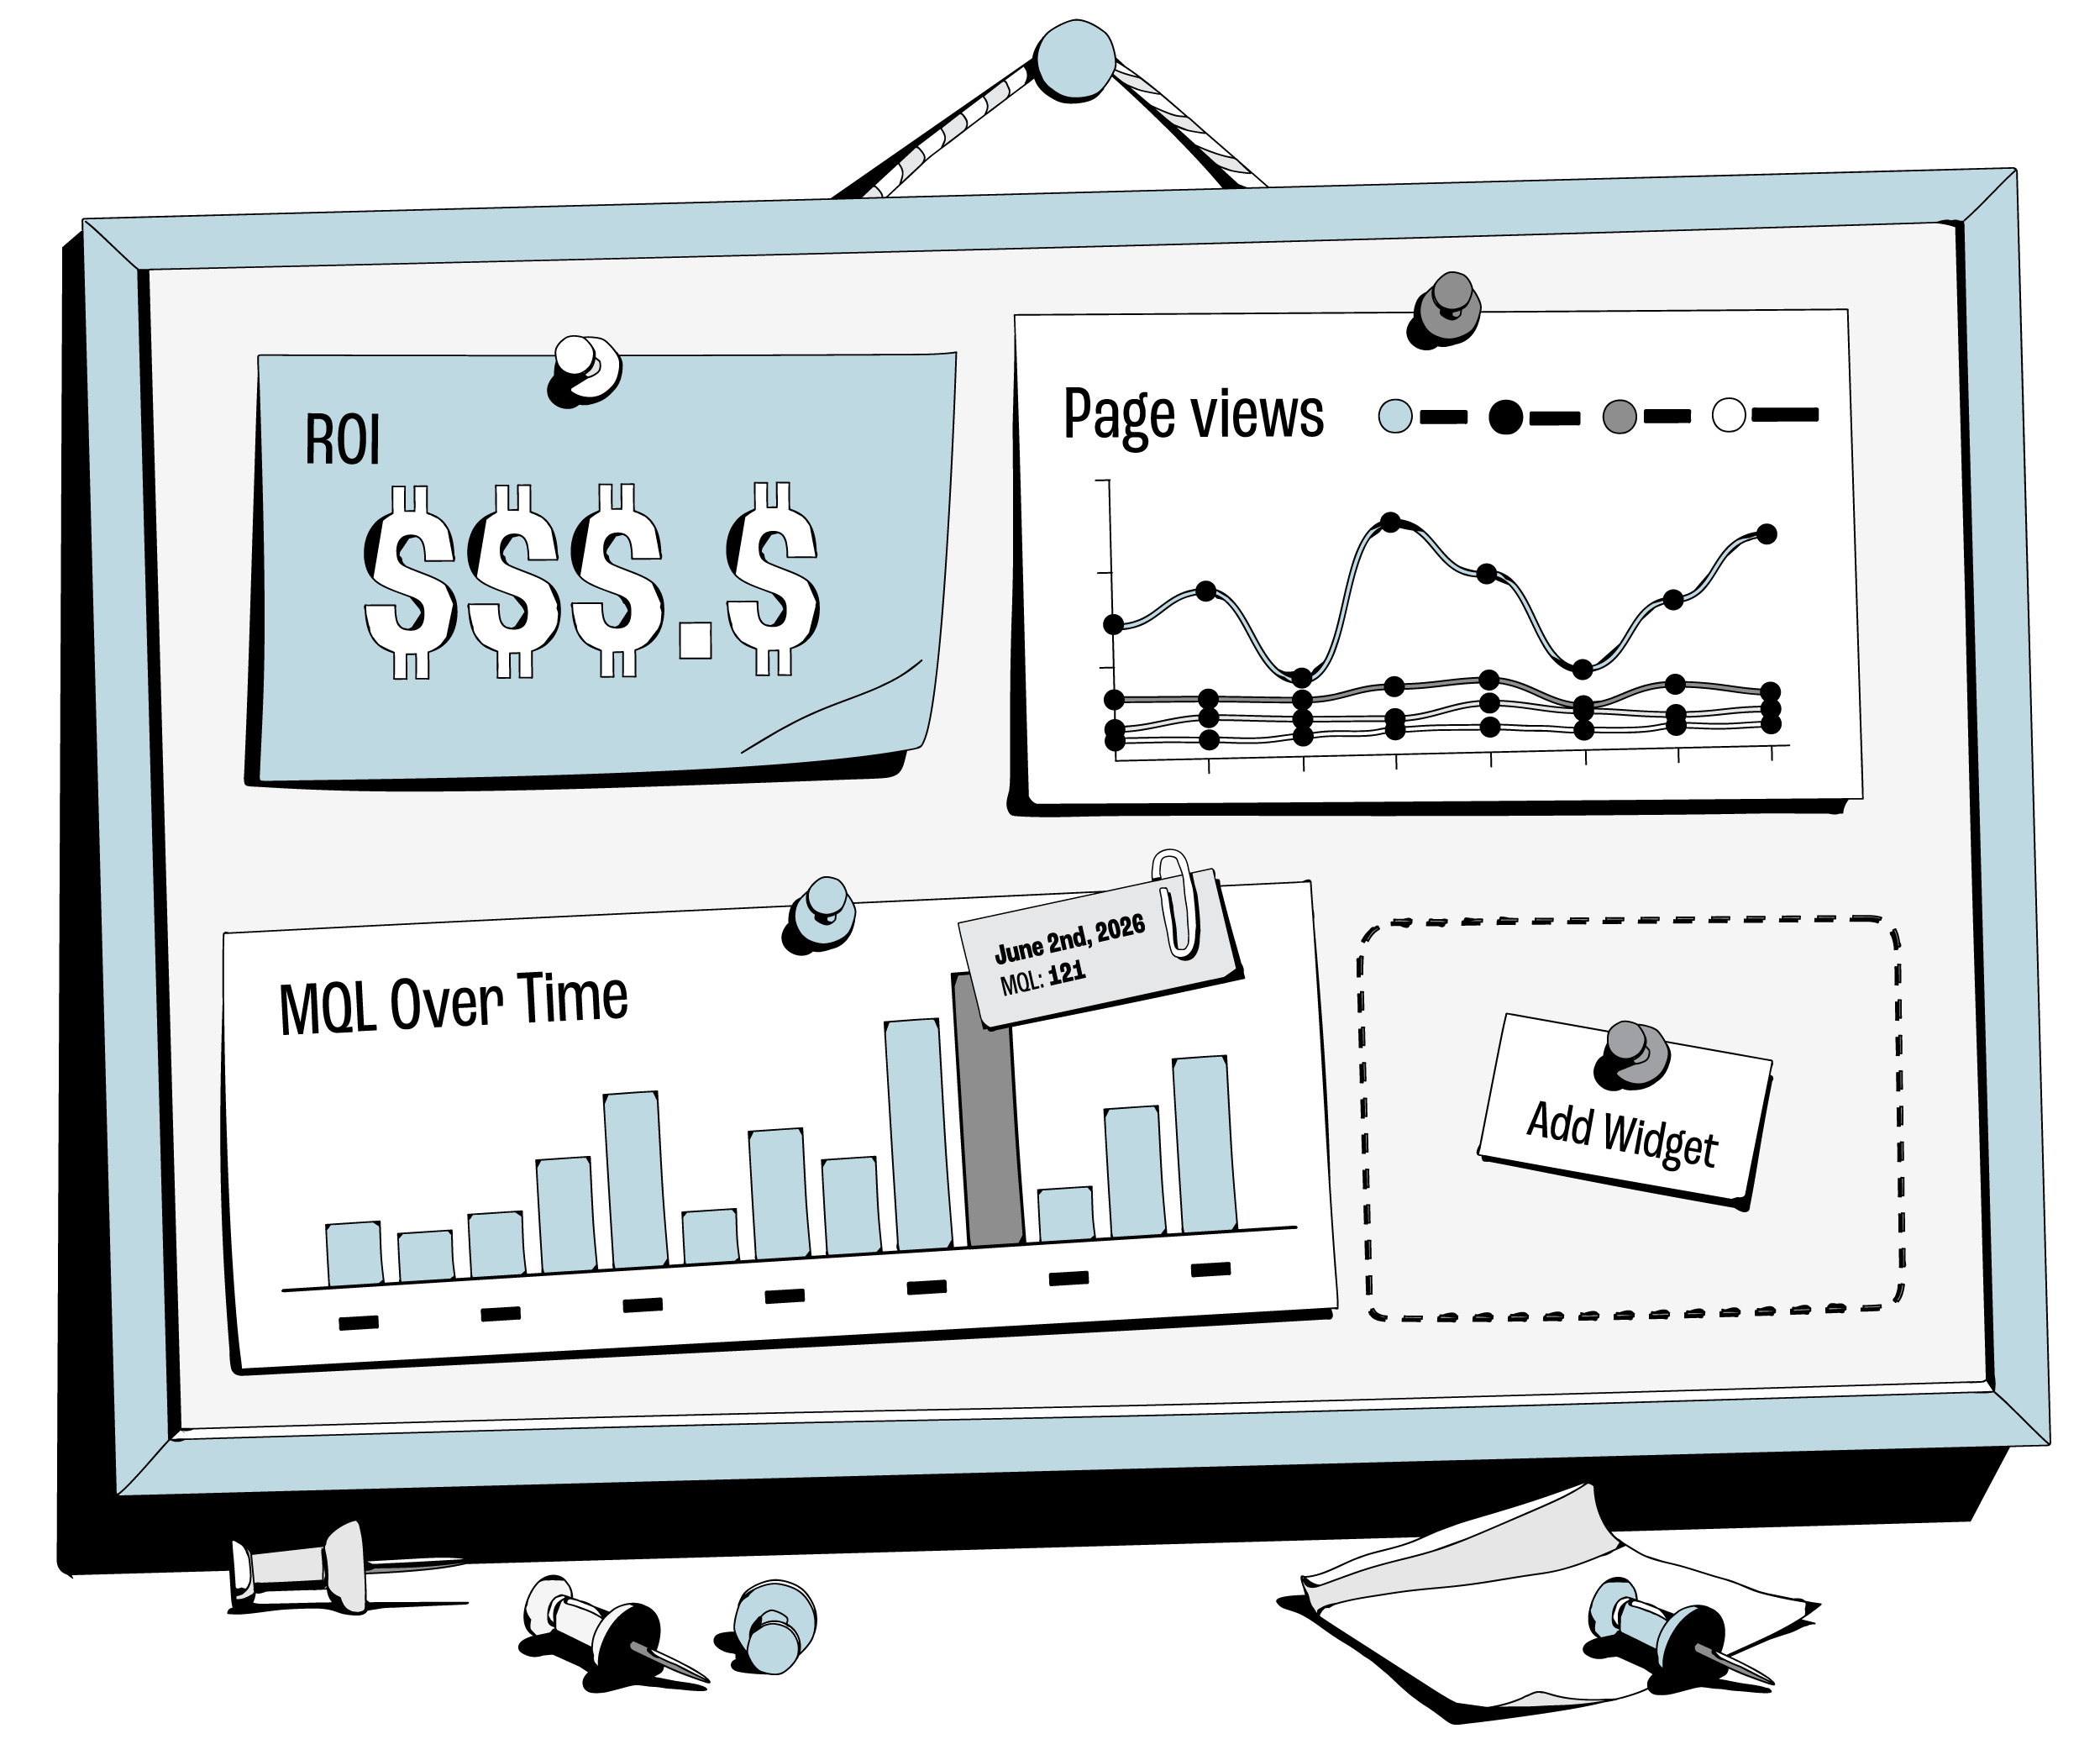

You know marketing drives revenue. Now you can prove it.
Dreamdata unifies all your GTM data and ties every touchpoint to revenue, giving you numbers you can stake your reputation on.
RETURN ON INVESTMENT
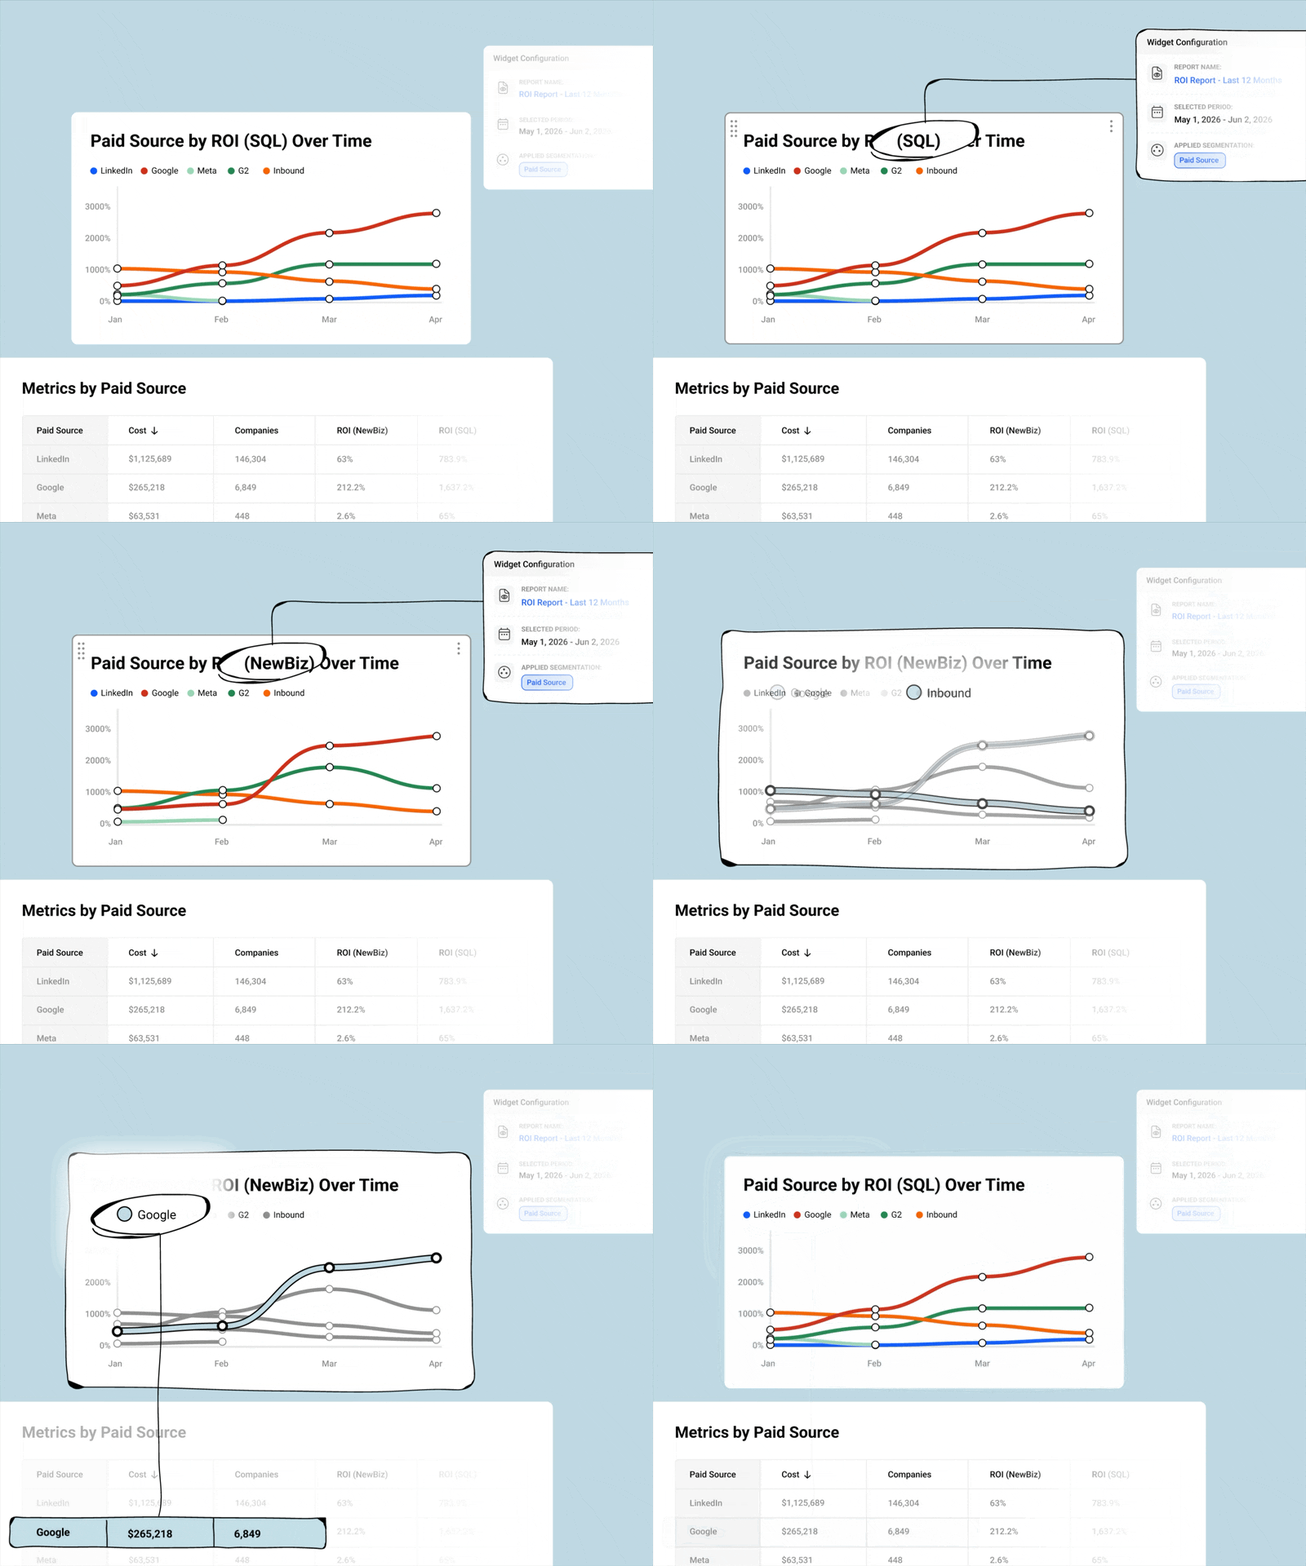
Measure ROI across every channel, online and offline
From Google Ads to last month's conference, see what each channel returned in pipeline and revenue, so you know exactly where to invest next (and where to cut costs).

Finastra goes from flying blind to over 10% ROI gains
RETURN ON AD SPEND
See what your ad platforms can’t tell you
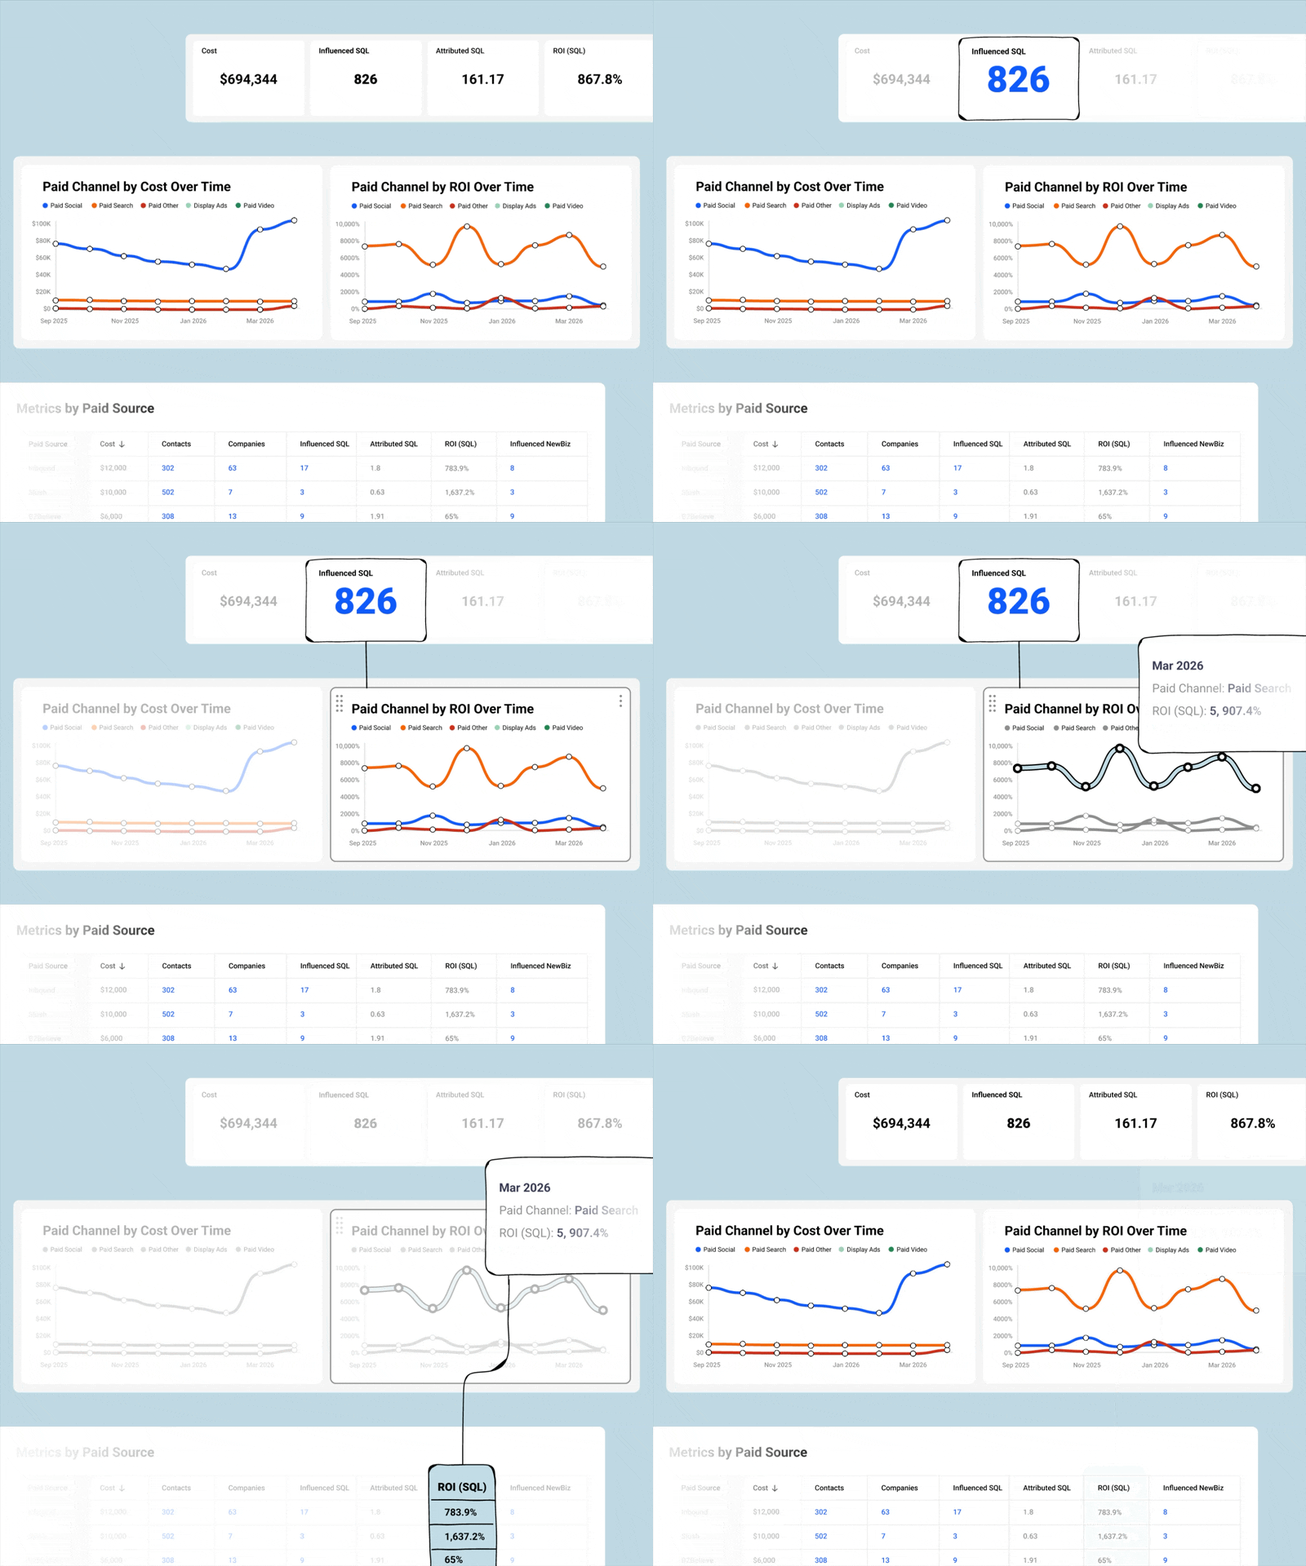
Measure and compare ROAS across every ad platforms in one place. Then break down performance by campaign, ad group, and keyword to see exactly what's driving pipeline and revenue, not just clicks.

Eftsure boosted Google Ads ROAS by 68% by focusing on top-performing campaigns
Don’t just take our word for it
-
![]()
"Getting month-by-month pipeline snapshots cut of Salesforce is hours and hours of work. Dreamdata gives me this breakdown in minutes. I can build dashboards for every cadence - weekly, monthly, QBRs - and go back to the board and say "invest in marketing, because I can prove how revenue starts here."
Adam Chapman-Ballard
Senior Director, Demand Generation
-
![]()
"I can pull in any report, across all our product lines, and have everything I need on a single dashboard. And if anyone questions a number, I can drill down to the contacts, companies, and deals behind it."
Jayant Kanchinadham
Marketing Operations Manager
-
![]()
"Before Dreamdata, we were relying on CRM data that only captured the last touchpoint. Now we have the full picture across an 8-month journey - and we can build custom dashboards per function, so the right data gets to the right team and actually gets acted on."
Trey Tran
Marketing Operations Lead



REVENUE ATTRIBUTION
Understand what moved the deal, not just what closed it
Quantify the pipeline and revenue generated by marketing across every channel and activity, from paid ads to in-person events.
Use AI-driven multi-touch attribution to understand which campaigns and activities actually move deals forward so you never again make budget decisions based on last-touch alone.
CUSTOM REPORTS
Build exactly what you need to measure
Anyone on your team can get the right answer they need without waiting on Ops. Let them define their own metrics, filters, segmentation, and attribution.

CUSTOM DASHBOARDS
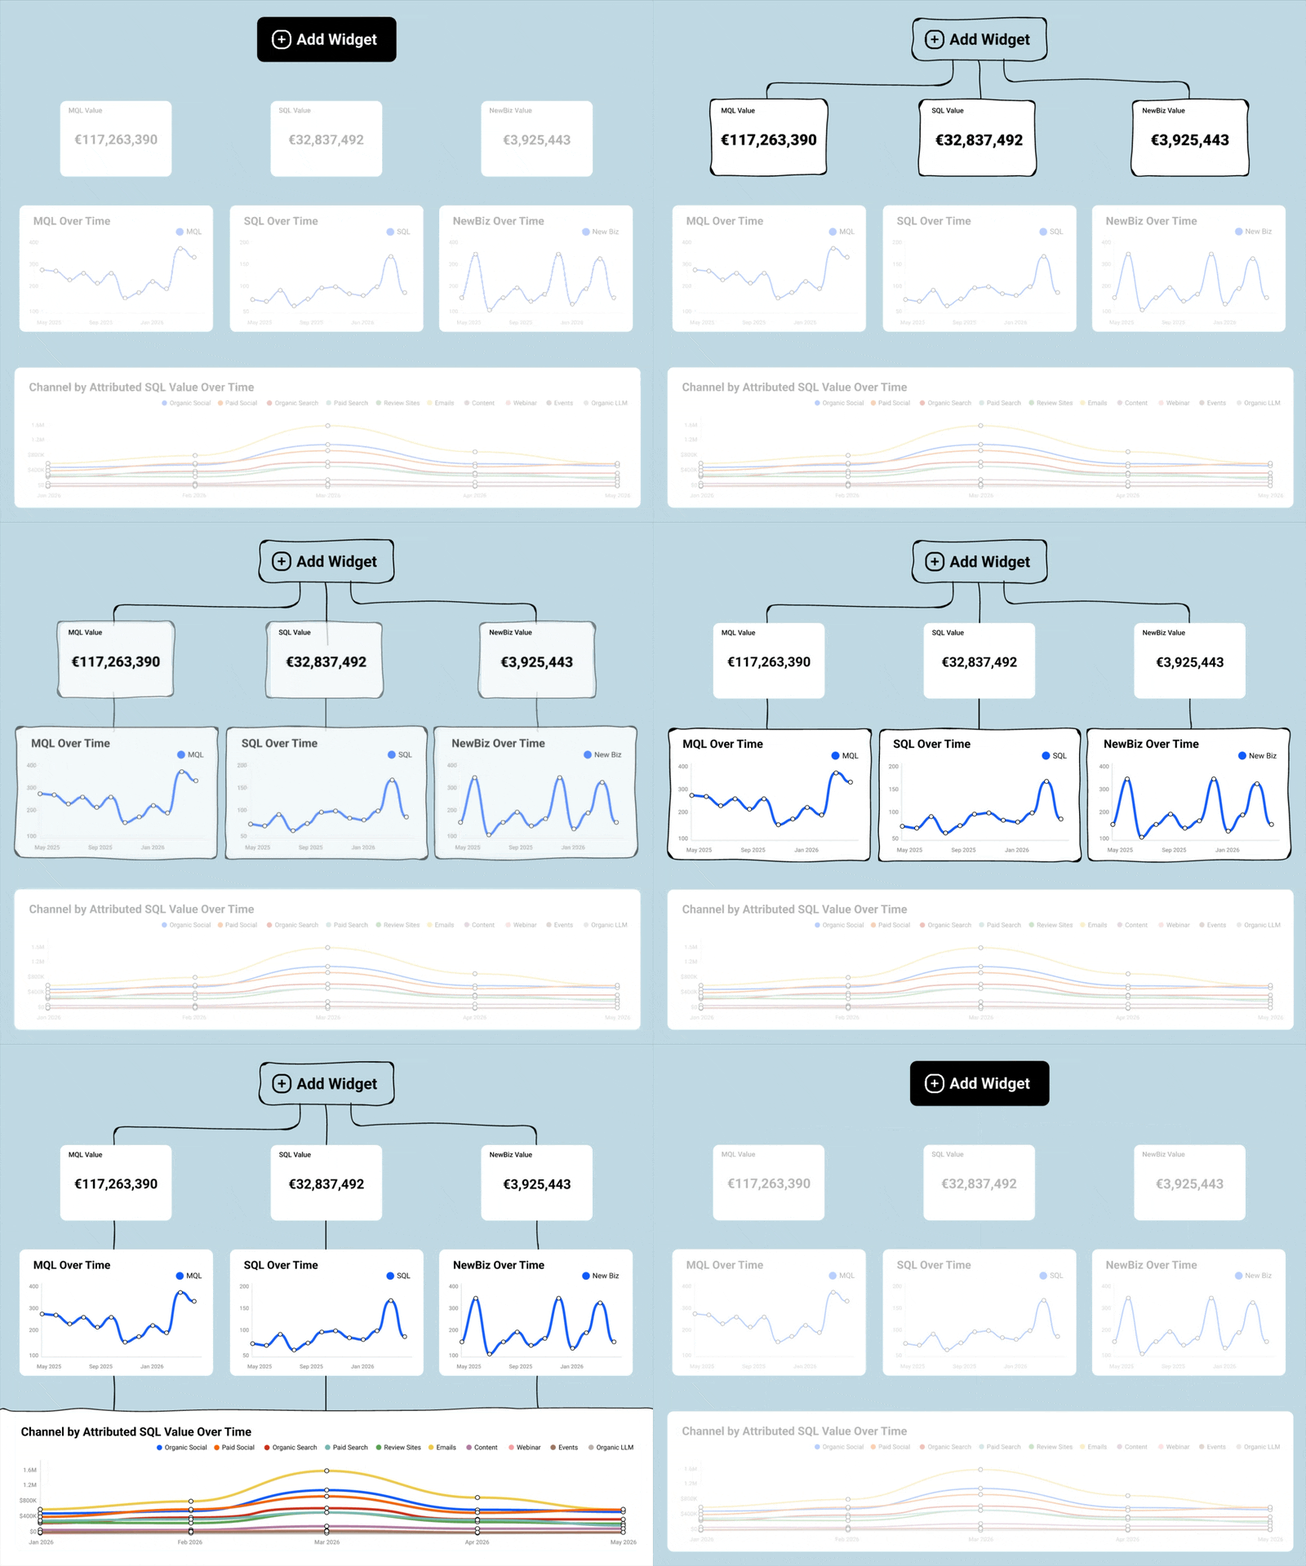
Every metric you need in one view
From a full marketing performance overview to a focused dashboard on content, paid, or events - anyone on your team can build a dashboard around how they report. When the report data updates, the dashboards update with it.

DRILL DOWN
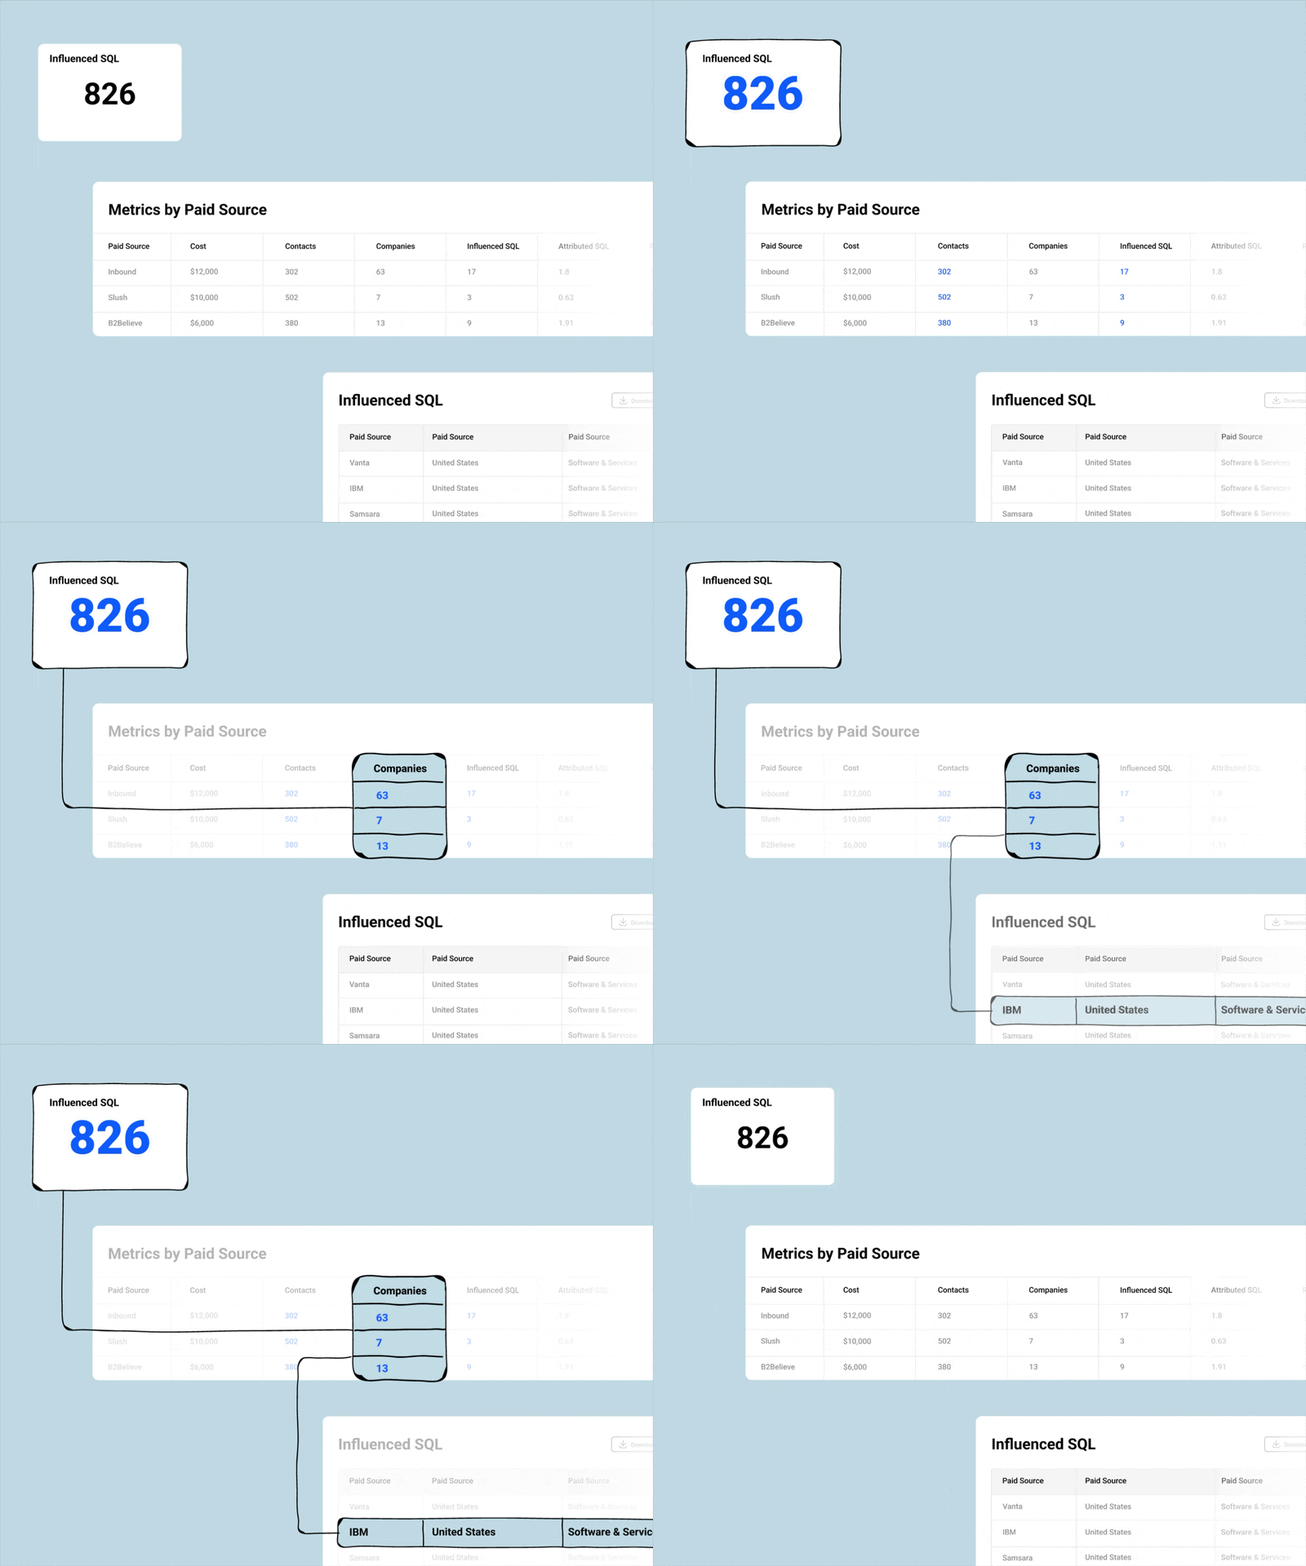
See exactly what’s behind every pipeline number
Click any pipeline number and see the exact contacts, companies, and deals behind it - right there in the meeting. Need to go deeper? Jump straight into the complete customer journey to show every touchpoint from first anonymous touch to closed won.
Numbers that trace back the source
Configured to how your business works
Control attribution logic and funnel measurement without professional services. Every report stays consistent from that point on.
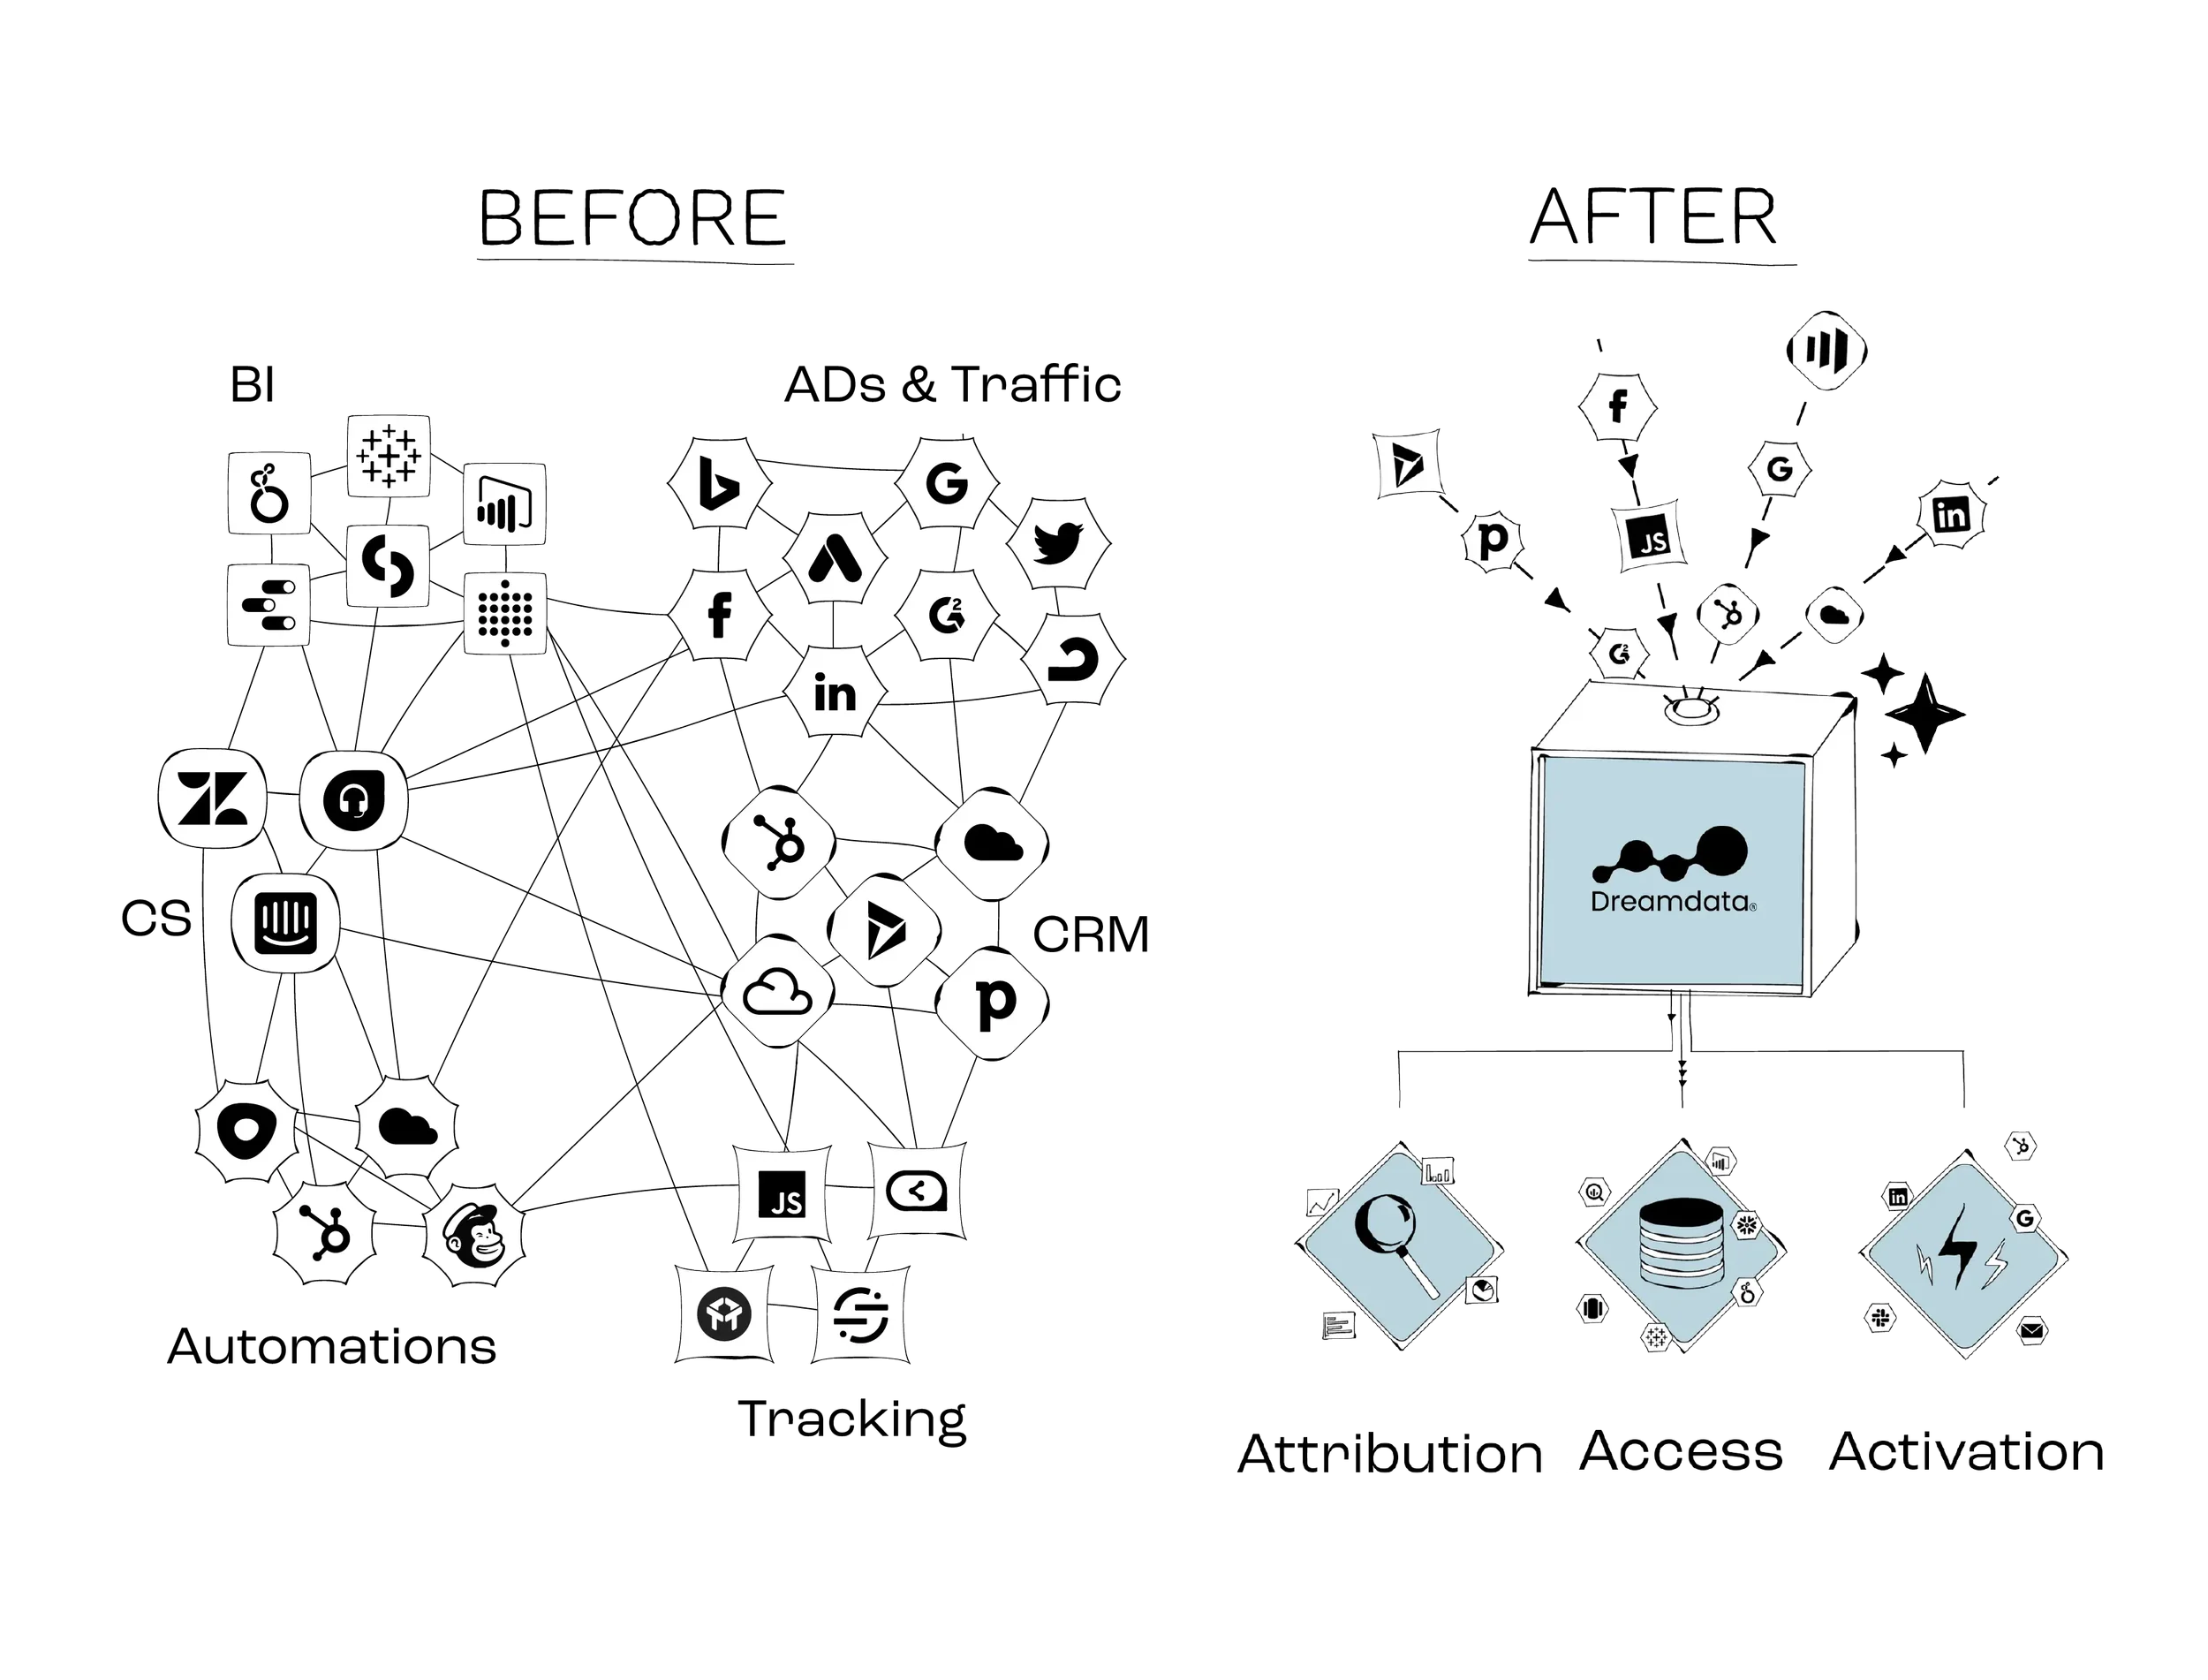
Built on the most complete customer journey
All your GTM data, from across your tech stack, unified in one place, organized by accounts, with every touchpoint tied to revenue.
Numbers that trace back to the source
Preview and validate the data behind every report. Every number traces back to the contacts, companies, and deals behind it.
SUCCESS STORIES
How Dreamdata helps B2B marketers measure their impact



Try for yourself
Analytics Hub FAQs
Find answers to the most common questions B2B marketers ask when evaluating Dreamdata Analytics Hub.
-
Pretty quickly. Analytics Hub comes with a variety of templates to help your team get started right away, so you’re not building everything from scratch.
Most teams get to their first meaningful reports and dashboards within the first few weeks of connecting their data sources.
-
Yes. You can fine-tune which touchpoints get credit based on how your business actually works.
If certain activities shouldn’t receive attribution, you can exclude them so the model reflects your reality more accurately.
-
Yes. You can bring offline activities like events, sponsorships, podcasts, and partner referrals into Dreamdata and report on them alongside your digital channels, so you can see their impact on pipeline.
You can bring offline data in two ways:
CRM integration: If you track offline activity in your CRM, you can turn any object into a trackable event in Dreamdata like event attendees or partner referrals with our Event Builder. Learn more →
Google Sheet: For anything that lives outside your CRM, you can import them via Google Sheet upload. Learn more about importing events via Google Sheet →
-
Yes. Anyone on your team can build their own reports and dashboards in Analytics Hub.
A demand gen manager can track channel ROI. A CMO can get an exec-ready view of pipeline. Ops can build and maintain the foundational reports everyone else uses.
And because the core rules are defined at the data layer, like what counts as a touchpoint, how pipeline stages are measured, and how attribution is applied - numbers stay consistent no matter who builds the report.
-
Yes, most of our customers do.
That might mean a hybrid PLG and sales-led motion, managing custom Salesforce objects, or serving multiple customer segments with very different buying journeys.
Dreamdata is built to handle that complexity without requiring months of implementation or a professional services team to get started.
-
Analytics Hub pulls together all your GTM data from your CRM, ad platforms, website activity, and marketing automation platform, then organizes it by account automatically.
Every touchpoint, from first anonymous visit to closed deal, is tied to pipeline and revenue.
You can define the rules that matter for your business: what counts as a touchpoint, how funnel stages are measured, and how attribution is applied - without relying on professional services teams to configure it for you.
Once those rules are set, every report and dashboard runs on the same foundation, so your team can build their own views without creating different versions of the truth.
And because you can preview and validate the data behind every report, you always know where a number comes from.