
How to measure marketing impact in B2B
Library > Measuring Marketing Impact
Written by Maimouna Corr Fonsbøl
Published on 20 October 2026
TL;DR: Measure B2B marketing impact by connecting campaign activity and costs to qualified pipeline and revenue. Agree on the metrics, check the account journeys behind the numbers, and use attribution to compare contribution.
When you need to know whether a campaign produced additional results, add a controlled experiment. Bring both types of evidence to your next budget decision.
1. Define the business outcome
Start with the decision: which campaign deserves more budget, which program needs changing, or where qualified accounts stop progressing. Agree with sales, RevOps, and Finance on the outcome that would make that decision clearer. Put the definition and data source in a short measurement plan.
Use three views together:
Qualified pipeline shows developing opportunities
Closed-won revenue shows completed deals
Cost shows the investment behind them
Attribution helps explain how credit is distributed across recorded activity. Experiments help assess what changed because of a campaign.
Agree on the foundations
Documented CRM stages and what each stage means (entry/exit criteria).
Clear ownership: marketing operations maintains tracking and campaign labels, RevOps maintains CRM definitions, and Finance confirms cost and revenue scope.
Write a short measurement plan
Primary outcomes: choose qualified pipeline and closed-won revenue, then label whether each figure is sourced, influenced, or attributed.
Conversion points: which events count for reporting (opportunity created, qualified opportunity, closed-won). Use the same conversion points across dashboards.
Sourced, influenced, and attributed rules:
Sourced: assign origin using an agreed rule, such as the first eligible recorded interaction. Explain whether the rule applies to the account or the opportunity.
Influenced: count deals with a qualifying marketing interaction before the selected outcome. Attributed: assign a share of deal value according to a model. Influenced totals can overlap across campaigns, so do not add them together as unique revenue.
Reporting level: connect people and activity to accounts and opportunities for pipeline and revenue reporting. Use contact-level detail to understand the people behind the journey.
Segments you will report every month: ICP tier, region, industry, product line (only include segments that change decisions).
Questions to answer:
Which channels source pipeline that closes?
Which channels show up before opportunity creation vs late-stage progression?
How do contribution and cost differ by target-account segment or region?
Where does velocity slow down between stages?
Dreamdata's account-based data model connects go-to-market activity around companies and their buying journeys. It’s the foundation for automated collection and attribution. This lets you inspect the accounts, opportunities, and touchpoints behind a report before deciding where to invest.
2. Connect marketing activity to accounts and opportunities
A campaign report becomes more useful when you can follow an account from engagement to an opportunity and its outcome.
Start with the events that matter to your question and check how they connect. Keep missing or unmatched activity visible so you can judge the coverage. For example, one contact may attend a webinar while a colleague requests a demo weeks later.
Bring both recorded interactions into the account journey. You can then investigate how the webinar fits into pipeline creation instead of judging it only by the attendee's form submissions.
Check the available records
CRM has accounts, contacts, opportunities, stages, amounts, close dates, and stage history.
Relevant form submissions, campaign interactions, and event activity are available from your marketing tools.
Campaign links follow a consistent UTM naming convention.
Check the important connections
Define the milestones you want to measure:
◦ For example: first recorded engagement, qualified opportunity, and closed-won. Buyers may return to earlier activities, so do not assume a single linear path.
◦ Use the same qualification criteria as sales. Record which fields and dates identify each outcome.Standardize UTMs and enforce them before launch:
◦ Required parameters: source, medium, campaign (add content/term when needed).
◦ Naming conventions that match reporting: channel grouping, region, product line.
◦ Assign an owner to check campaign tags before launch and correct inconsistent values.Check how forms identify contacts and companies:
◦ Use the available contact and company fields to match records. Check how personal email domains and subsidiaries are handled.
◦ Test a known submission and confirm that it connects to the expected contact and account, without duplicating the event.Log offline touches in systems that connect to pipeline:
◦ Events/webinars: store attendance in marketing automation and/or CRM campaign membership.
◦ Meetings: ensure they associate to the right account and opportunity where possible.Apply CRM hygiene that directly affects measurement:
◦ Dedupe contacts; standardize account naming and domains.
◦ Enforce opportunity-to-account linkage.
◦ Use opportunity-contact roles where possible so buying committee touches can associate to the deal.
Use Dreamdata's Customer Journeys to inspect the recorded account and contact timelines. Review a deal that sales knows well: are the webinar, demo, and opportunity events present and correctly associated? That record-level check helps you distinguish a performance issue from missing or misclassified data.
3. Bring activity, costs, and outcomes together
Your CRM holds opportunities and deal values, ad platforms hold campaign spend, and marketing tools and website tracking hold engagement. Connect the sources through consistent account and campaign identifiers so you can compare investment with outcomes for the same group.
Choose your reporting basis deliberately. A campaign launched this month may need months to produce closed-won revenue.
Compare campaigns at similar stages of maturity, and separate results for a campaign cohort from revenue that happened to close during the same calendar period.
Gather the relevant inputs
Access to CRM opportunity data (including stage history) and revenue fields.
Campaign and event data for the activity you want to evaluate.
Campaign costs and any additional program costs included in your chosen efficiency metric.
Website activity collected by your tracking setup, including earlier recorded visits that can be connected after identification.
Connect the sources for your first question
CRM + marketing automation: accounts, contacts, opportunities, stages, revenue, campaign membership.
Web tracking: to connect early engagement to later pipeline/revenue.
Ad platforms: to connect campaigns and costs to outcomes.
Add offline events or other relevant sources as needed. Confirm what history is available before choosing the reporting window.
Check the key fields
Identity: account ID, account domain, contact email, contact-to-account association rules.
Opportunity: opportunity ID, created date, stage history, close date, amount, outcome.
Touch metadata: channel, campaign identifiers, UTM fields, timestamps.
Validate a sample of deals
Choose a manageable sample across the segments you report, including accounts with several contacts or opportunities.
Confirm the journey includes the major touches you know happened (ads, key pages, emails, events).
Confirm that contact and company matches are correct, and check how activity relates to accounts with more than one opportunity.
Compare opportunity values, currencies, stage dates, and reporting filters with the CRM.
In Dreamdata's Data Hub, define the stages and attribution rules and preview the records they select. Check your qualified-pipeline and closed-won definitions against known deals before sharing the reports. Save a snapshot of the numbers used in a budget decision so later changes can be explained.
4. Use attribution to compare marketing contribution
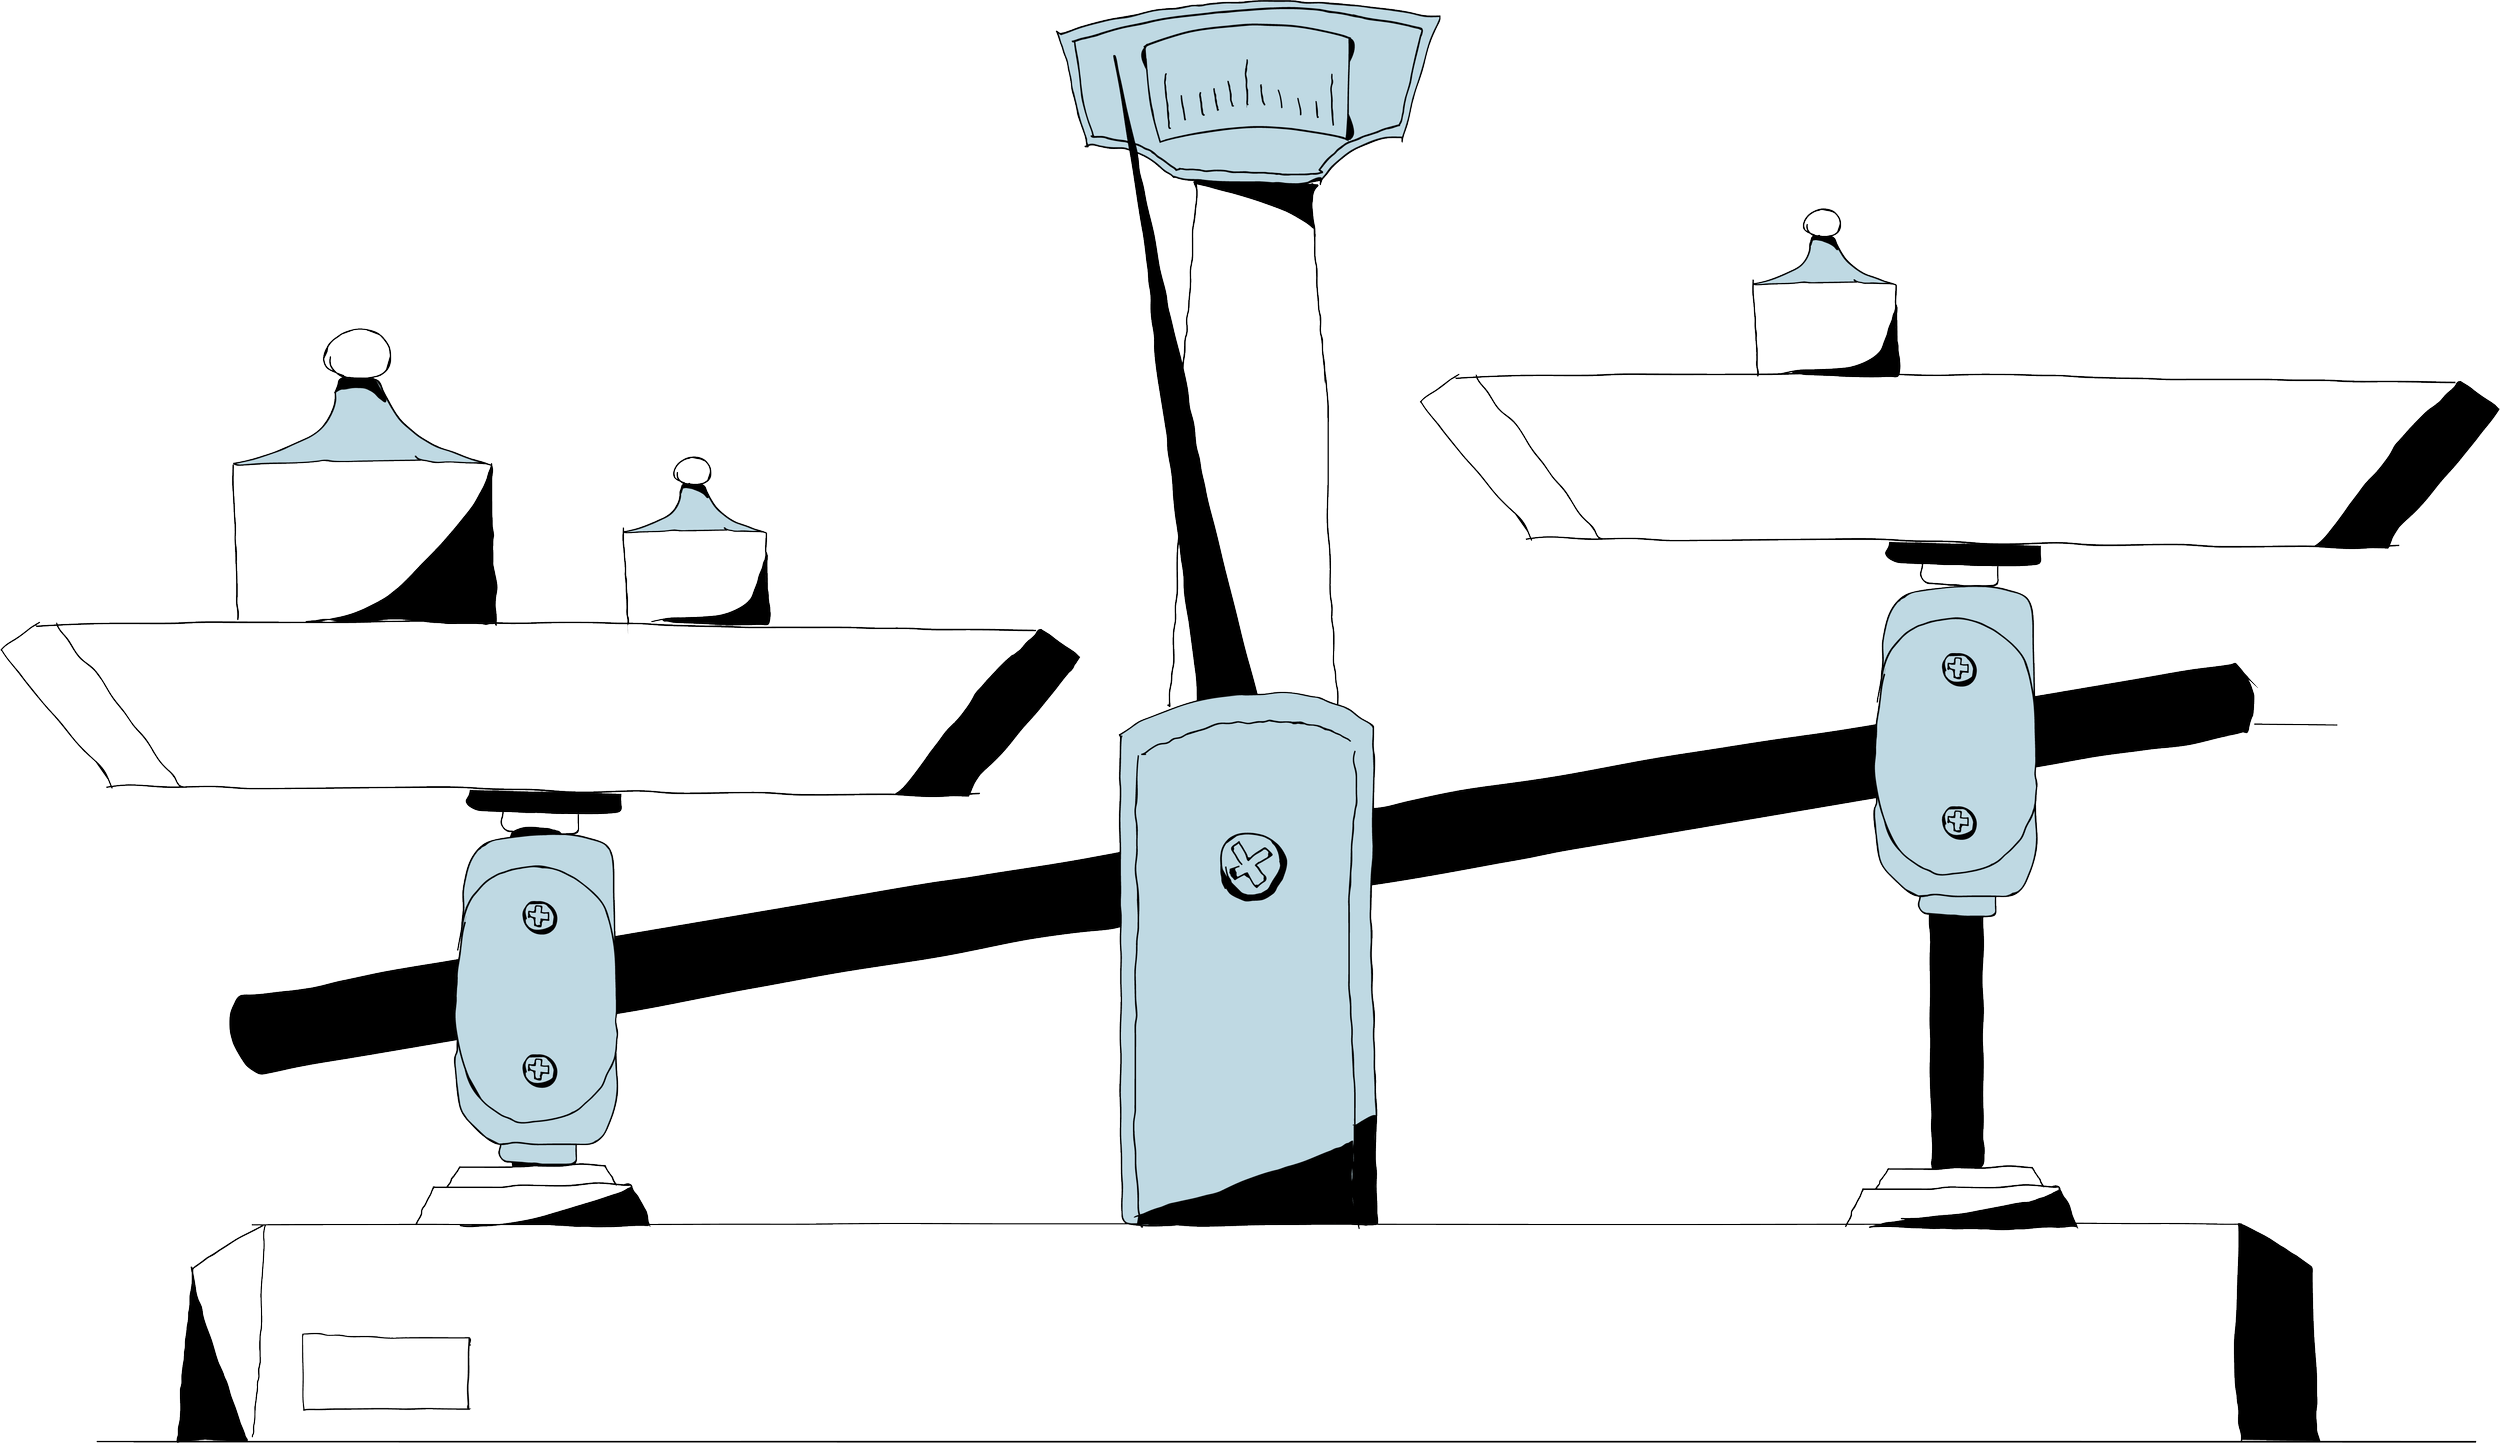
Choose a reporting model, then compare it with another perspective when that helps answer the question. Keep the outcome, accounts, dates, and filters consistent. A change in assigned credit should be explainable by the model's rules.
Consider the example of an $100,000 closed-won deal with four eligible touchpoints: a paid social click, a webinar, an organic search visit, and a sales meeting. Linear attribution assigns $25,000 to each. First-touch assigns the full $100,000 to the paid social touch.
These are different ways to allocate the same deal value; they do not show how much revenue would disappear without either campaign.
Check before comparing models
Unified account journeys that include web, campaign, and CRM opportunity data.
Defined conversion points (pipeline and/or revenue) from your measurement charter.
Match the model to the question
First-touch: where does the recorded journey begin among accounts that later reach the selected outcome?
Last-touch: which eligible interactions appear immediately before the outcome?
Multi-touch: how does credit spread across the eligible journey? Linear divides it equally; W-shaped gives more weight to selected milestones.
Keep the rules visible
Journey window: use your own time-to-outcome data to assess whether early activity is being excluded. Record changes to the rule.
Touch inclusion: which channels count (ads, email, events, web, product) and whether sales touches are included.
Event eligibility: define which visits, clicks, or other events qualify. Include impressions only where the source and attribution setup support them.
Attribution target: pipeline, revenue, or both; keep reporting consistent across teams.
Model comparisons: investigate meaningful differences, such as a channel appearing early in journeys but rarely receiving last-touch credit.
Dreamdata's attribution models let you compare channel and campaign contribution on the same account-based foundation. Inspect the journeys behind a large change in credit before moving budget. Combine the report with campaign costs, account quality, and the time available for deals to develop.
5. Use the evidence to improve campaigns
Bring a short recommendation to your regular planning meeting: what you learned, what you want to change, and what result you will check next. A report should make the next budget decision easier to explain.
Prepare the decision
Use agreed definitions and label pipeline, revenue, influenced value, and attributed value clearly.
Match the cost scope to the metric. Ad spend supports ROAS; a broader ROI or acquisition-cost calculation needs the additional costs included in its definition.
Assign an owner to each campaign change or experiment.
Review at a useful pace
Weekly: inspect tracking issues, campaign delivery, and early movement among suitable accounts.
Monthly: review pipeline, revenue, and cost by the segments that affect budget decisions. Show which campaign cohorts are still developing.
Quarterly: review investment choices, acquisition efficiency, and the results of experiments with leadership.
Use pipeline conversions in campaign optimization
Choose meaningful conversion events, such as a qualified opportunity or closed-won deal. Avoid treating every CRM change as an equally valuable outcome.
Dreamdata's conversion syncs send selected pipeline outcomes to supported ad platforms so optimization can use signals beyond the initial form submission.
Before changing bidding, verify event mapping, duplicate handling, and the selected platform's requirements and available conversion volume.
Review downstream account quality and pipeline progression alongside spend and lead costs.
Test additional impact with a holdout
If attribution suggests a campaign contributes to revenue, test whether it adds outcomes you would otherwise miss.
For example, randomly assign eligible accounts to a campaign group and a holdout, then compare the predefined outcome over a suitable period. Plan sample size, account overlap, and other campaign exposure before launch.
Define the primary outcome and test period in advance. Qualified opportunities may be measurable earlier than closed-won revenue, but report the outcome you actually tested.
Illustrative result: 50 of 1,000 campaign accounts create an opportunity, versus 40 of 1,000 holdout accounts. That is 5% versus 4%, a 1 percentage-point difference and 25% relative lift in the observed sample.
Assess uncertainty before drawing a conclusion. A small difference can be noise; extend the planned study or use the findings to design the next test when the evidence is inconclusive.
Build audiences from the account journey
Build audiences by the account journey stage (examples: repeat visitors from target accounts, accounts in evaluation, open opportunities needing late-stage reinforcement).
Dreamdata's Audience Hub lets you define audiences using account properties and engagement, then sync them to yoursupported ad platforms. Review the included companies, exclusions, and destination before activating.
Check whether the audience produces suitable accounts and useful pipeline. Matching and delivery are intermediate measures; the business outcome is what informs the next investment.
Start with one investment decision
Agree on the outcome, account group, cost scope, and measurement window for a campaign you need to evaluate.
Check its tracking and campaign labels, then confirm the opportunity and revenue definitions with sales and Finance.
Inspect a sample of account journeys and reconcile deal values and filters with the CRM.
Compare attribution perspectives, propose one action, and decide whether a controlled experiment is needed to assess additional impact.
Use your own go-to-market data to validate the approach in Dreamdata. Connect a familiar campaign to the accounts and opportunities behind it, check the numbers, and use the result to make a concrete budget recommendation.
FAQs
1. What’s the difference between marketing-sourced and marketing-influenced pipeline?
Sourced pipeline assigns origin using your agreed rule, such as the first eligible recorded touch. Influenced pipeline includes opportunities with a qualifying interaction before the chosen outcome.
Several campaigns can influence the same opportunity, so their influenced values overlap. Label the measure and avoid adding overlapping totals together.
2. Which attribution model should we use for long B2B journeys?
Choose a model that fits the decision and compare it with another perspective.
First-touch helps you inspect how recorded journeys begin; last-touch focuses on activity before the outcome; multi-touch distributes credit across eligible interactions. Check the journey window against your own sales cycle and explain the rules alongside the report.
3. What should we report to the board?
Show qualified pipeline, closed-won revenue, and acquisition efficiency with clear definitions and relevant cost scope. Explain which campaign cohorts are mature enough to assess, what the evidence suggests changing, and what experiments have found. Keep the account-level detail available for questions about the numbers.