
#dreamdatarecipes
Tracking LLM influence on pipeline and revenue with Dreamdata
TL;DR: This recipe shows you how to track website traffic from LLMs using Dreamdata, so you can measure how LLM-sourced traffic impacts your pipeline and revenue.
Large language models (LLMs) are now a standard for researching brands, services, or products.
Instead of following a link from Google search, people ask these AI chatbots their questions directly and click on the suggested pages.
This shift means that a big portion of your potential audience is now engaging with your content through an entirely new lens.
So, naturally, we want to know how to measure the impact of this 'LLM-sourced' traffic with Dreamdata.
In this recipe, we will look at website traffic coming from LLMs and how this influences pipeline and revenue.
Skip ahead to:
Step 1: Categorize LLM touches
Step 2: Analyze page traffic on your website coming from LLMs
Step 3: LLM impact on each stage of the funnel
Step 1: Categorize LLM touches
To analyze the influence of LLMs, we need to categorize LLM touches into the right channels and sources.
Go to the Data Hub, where you can control your data to ensure your reporting is accurate and reliable.
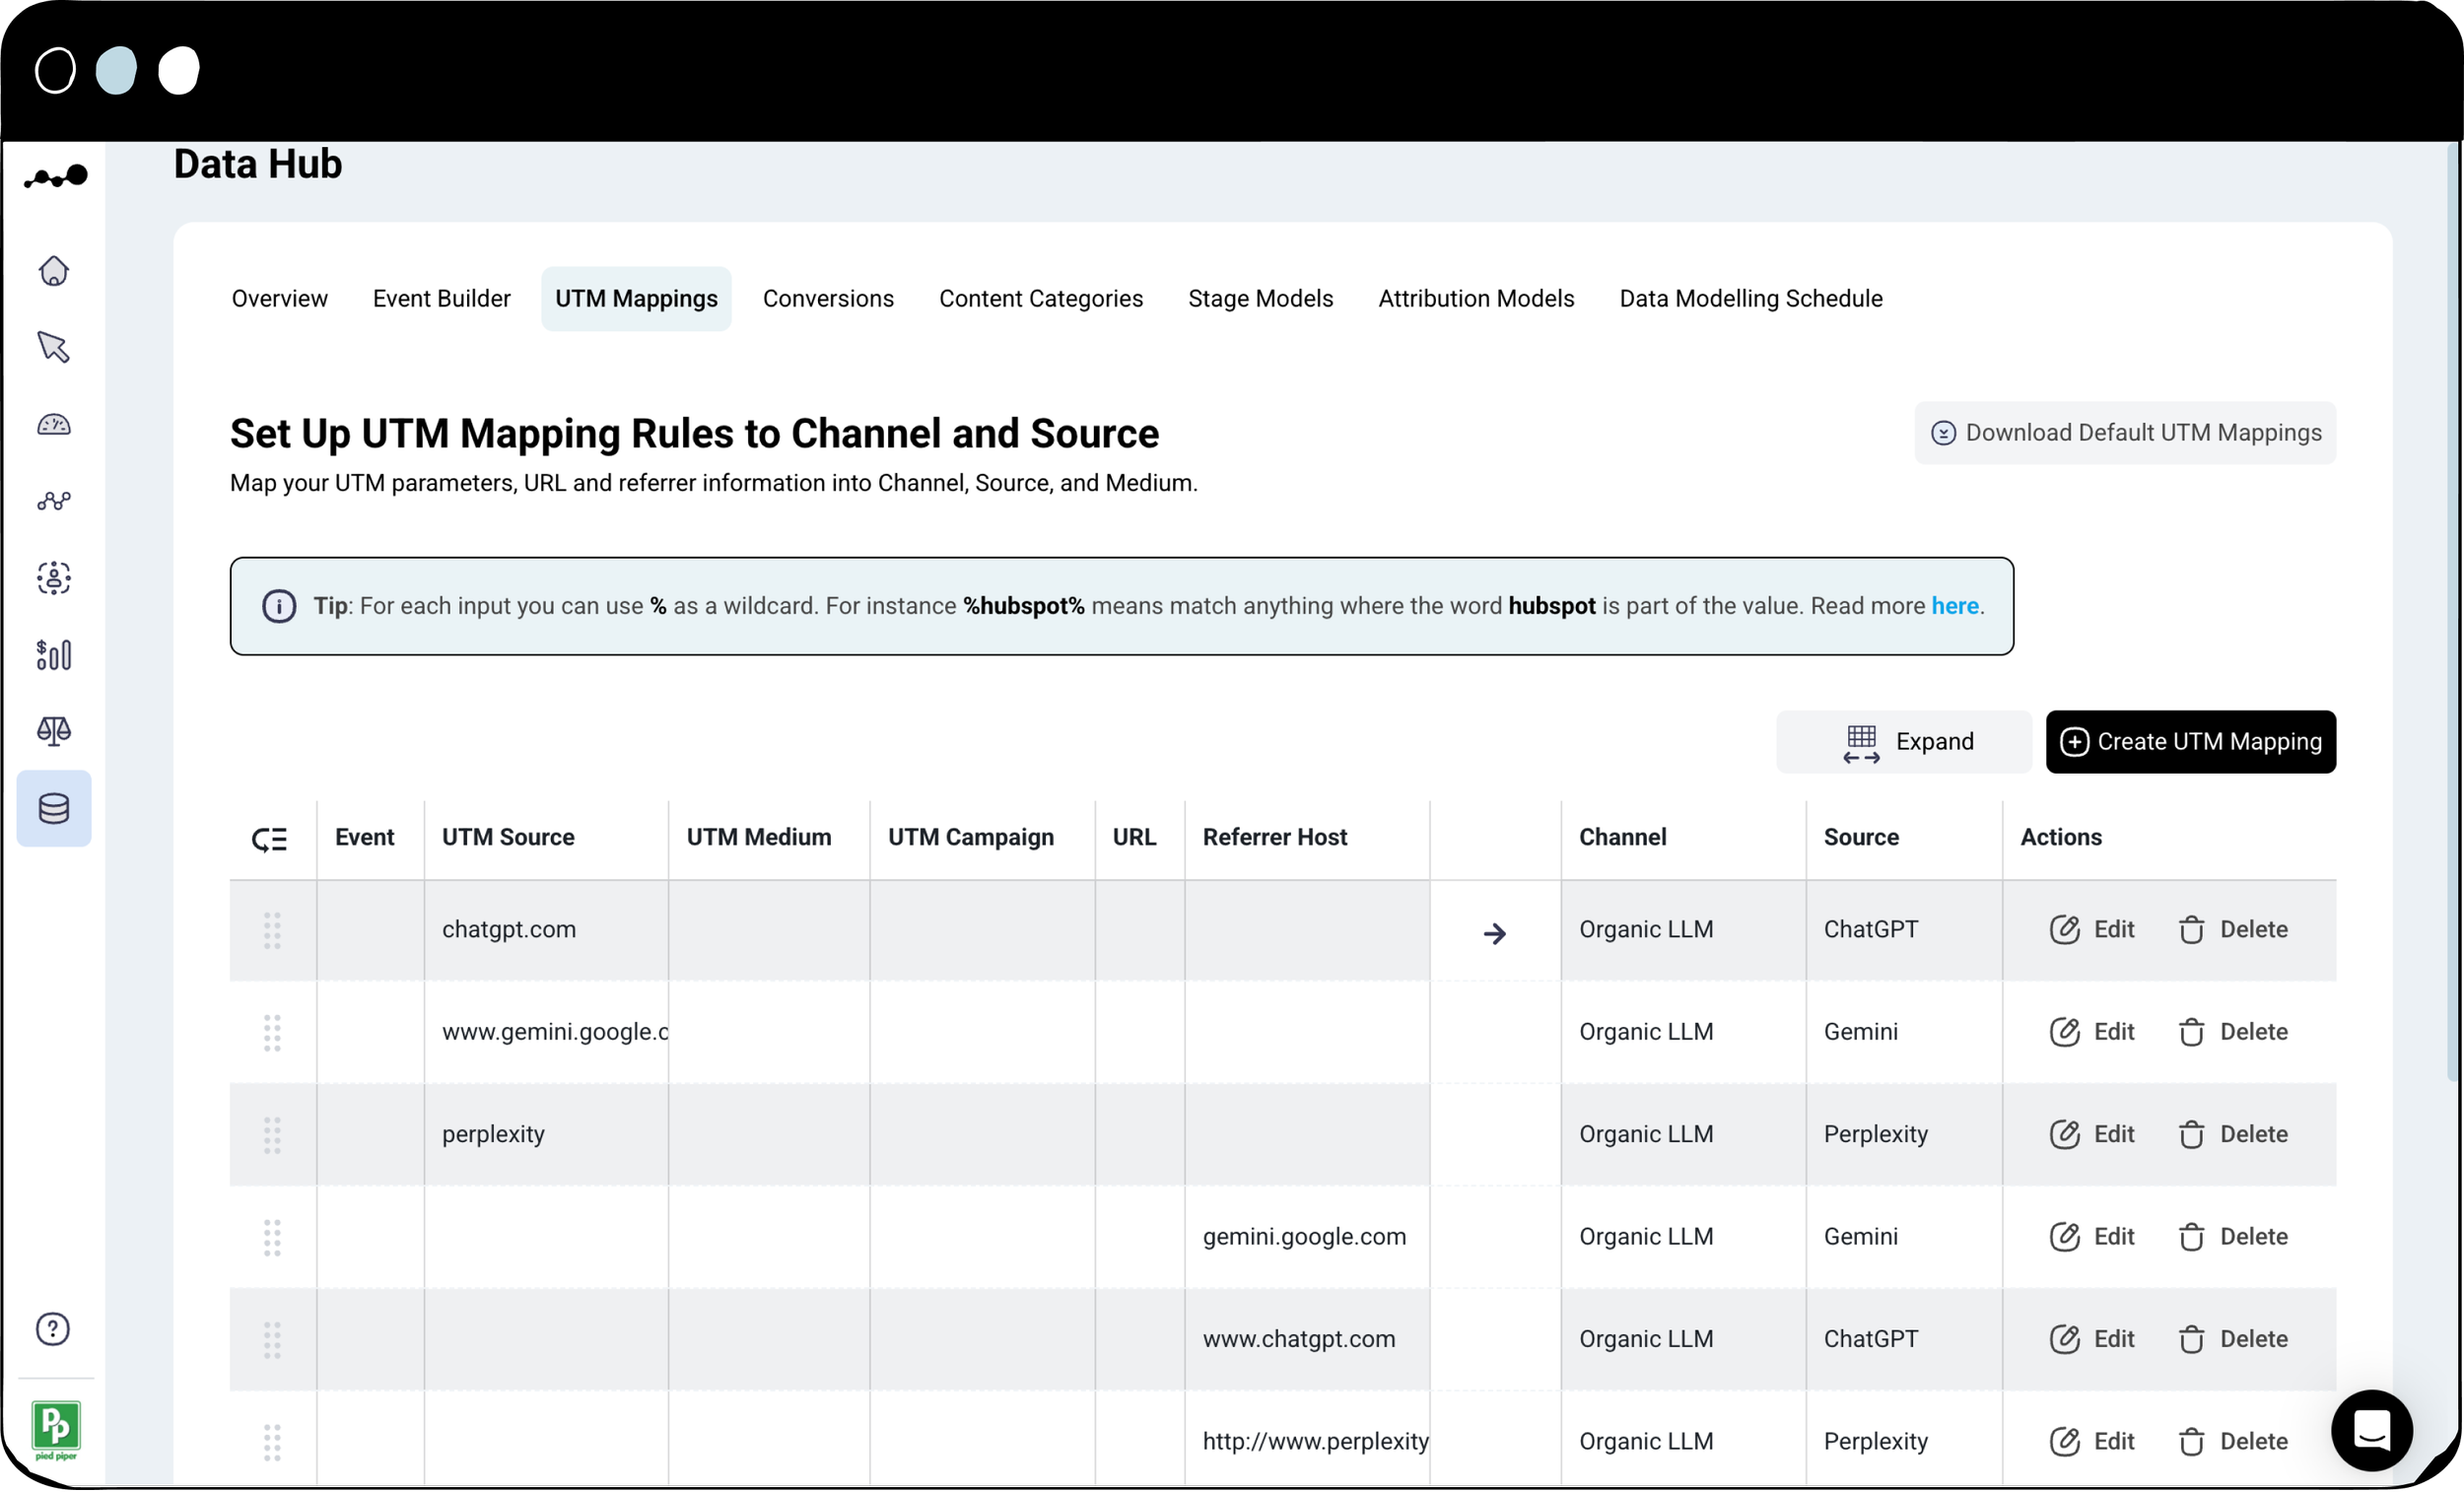
Click on ‘UTM Mappings’. We automatically map UTM parameters directly into standardized channels and sources. You can always edit these.
As you can see from the screenshot, we’ve already mapped three UTM Sources: ChatGPT, Gemini, and Perplexity to the channel ‘Organic LLM’ and into their respective sources.
This categorizes any traffic with these specific UTM source tags as coming from those LLMs.
We’ve also done this for Referrer Hosts. If a link suggested by the LLMs lacks a UTM Source, any incoming traffic would be falsely categorized as “direct”.
To avoid this, we mapped the LLMs as Referrer Hosts so you won’t miss out on any incoming traffic from ChatGPT, Gemini, and Perplexity.
Once your data model updates, you’ll be able to filter Dreamdata report by this channel and sources.
To start a manual update, head to Data Hub > Data Modelling Schedule.
Step 2: Analyze page traffic on your website coming from LLMs
Let’s head to Engagement > Pages to identify and analyze website activity coming from LLMs over the past 12 months, and measure the MQLs this traffic yielded.
Time period: last 12 months
Stage model: MQL
Channel: Organic LLM
Secondary Group By: Source


We can see that 1,855 page views came from LLMs in the last 12 months and these have influenced 30 MQLs with a value of €820,0000.
In the graph ‘Views Group By URL Over Time’, we can see that the incoming LLM-sourced traffic has significantly increased since the beginning of 2025.
This shows a rising trend in the number of people using AI chatbots for search.
Let’s sort the table ‘URL Performance Group by Source’ by ‘Influenced Value’ to see which LLM-surfaced URLs have the highest influence on MQL generation.

We can see that our benchmark reports have a high ‘Influenced Value’, e.g., ‘B2B go-to-market benchmarks 2024’ and our ‘LinkedIn Ads Benchmark Report’.
This highlights that not only are our benchmark reports being surfaced by LLMs, but they are also effectively generating MQLs.
This presents a good argument to continue developing our very popular benchmark reports.
Step 3: LLM impact on each stage of the funnel
To quantify the impact of LLMs on business outcomes, we need to go to Revenue Analytics > Attribution.
Let’s start by measuring the MQLs generated over the last 12 months and the impact of LLMs on this outcome.
Time period: last 12 months
Stage model: MQL
Channel: Organic LLM
Group by: Source

Of the MQLs generated in the last 12 months, 13.5 were attributed to LLMs.
While this represents less than 1% of MQLs, we need to consider the B2B marketing time lag.
Our data shows that it can take at least 6 months for 50% of the revenue from a marketing initiative to be realized.
Given that LLMs surface content, our next step is ‘Revenue Analytics > Content Analytics’.
Let’s begin by looking at the MQLs generated over the last 12 months that were influenced by LLM-surfaced content.
Time period: last 12 months
Stage model: MQL
Channel: Organic LLM
Secondary Group By: Source
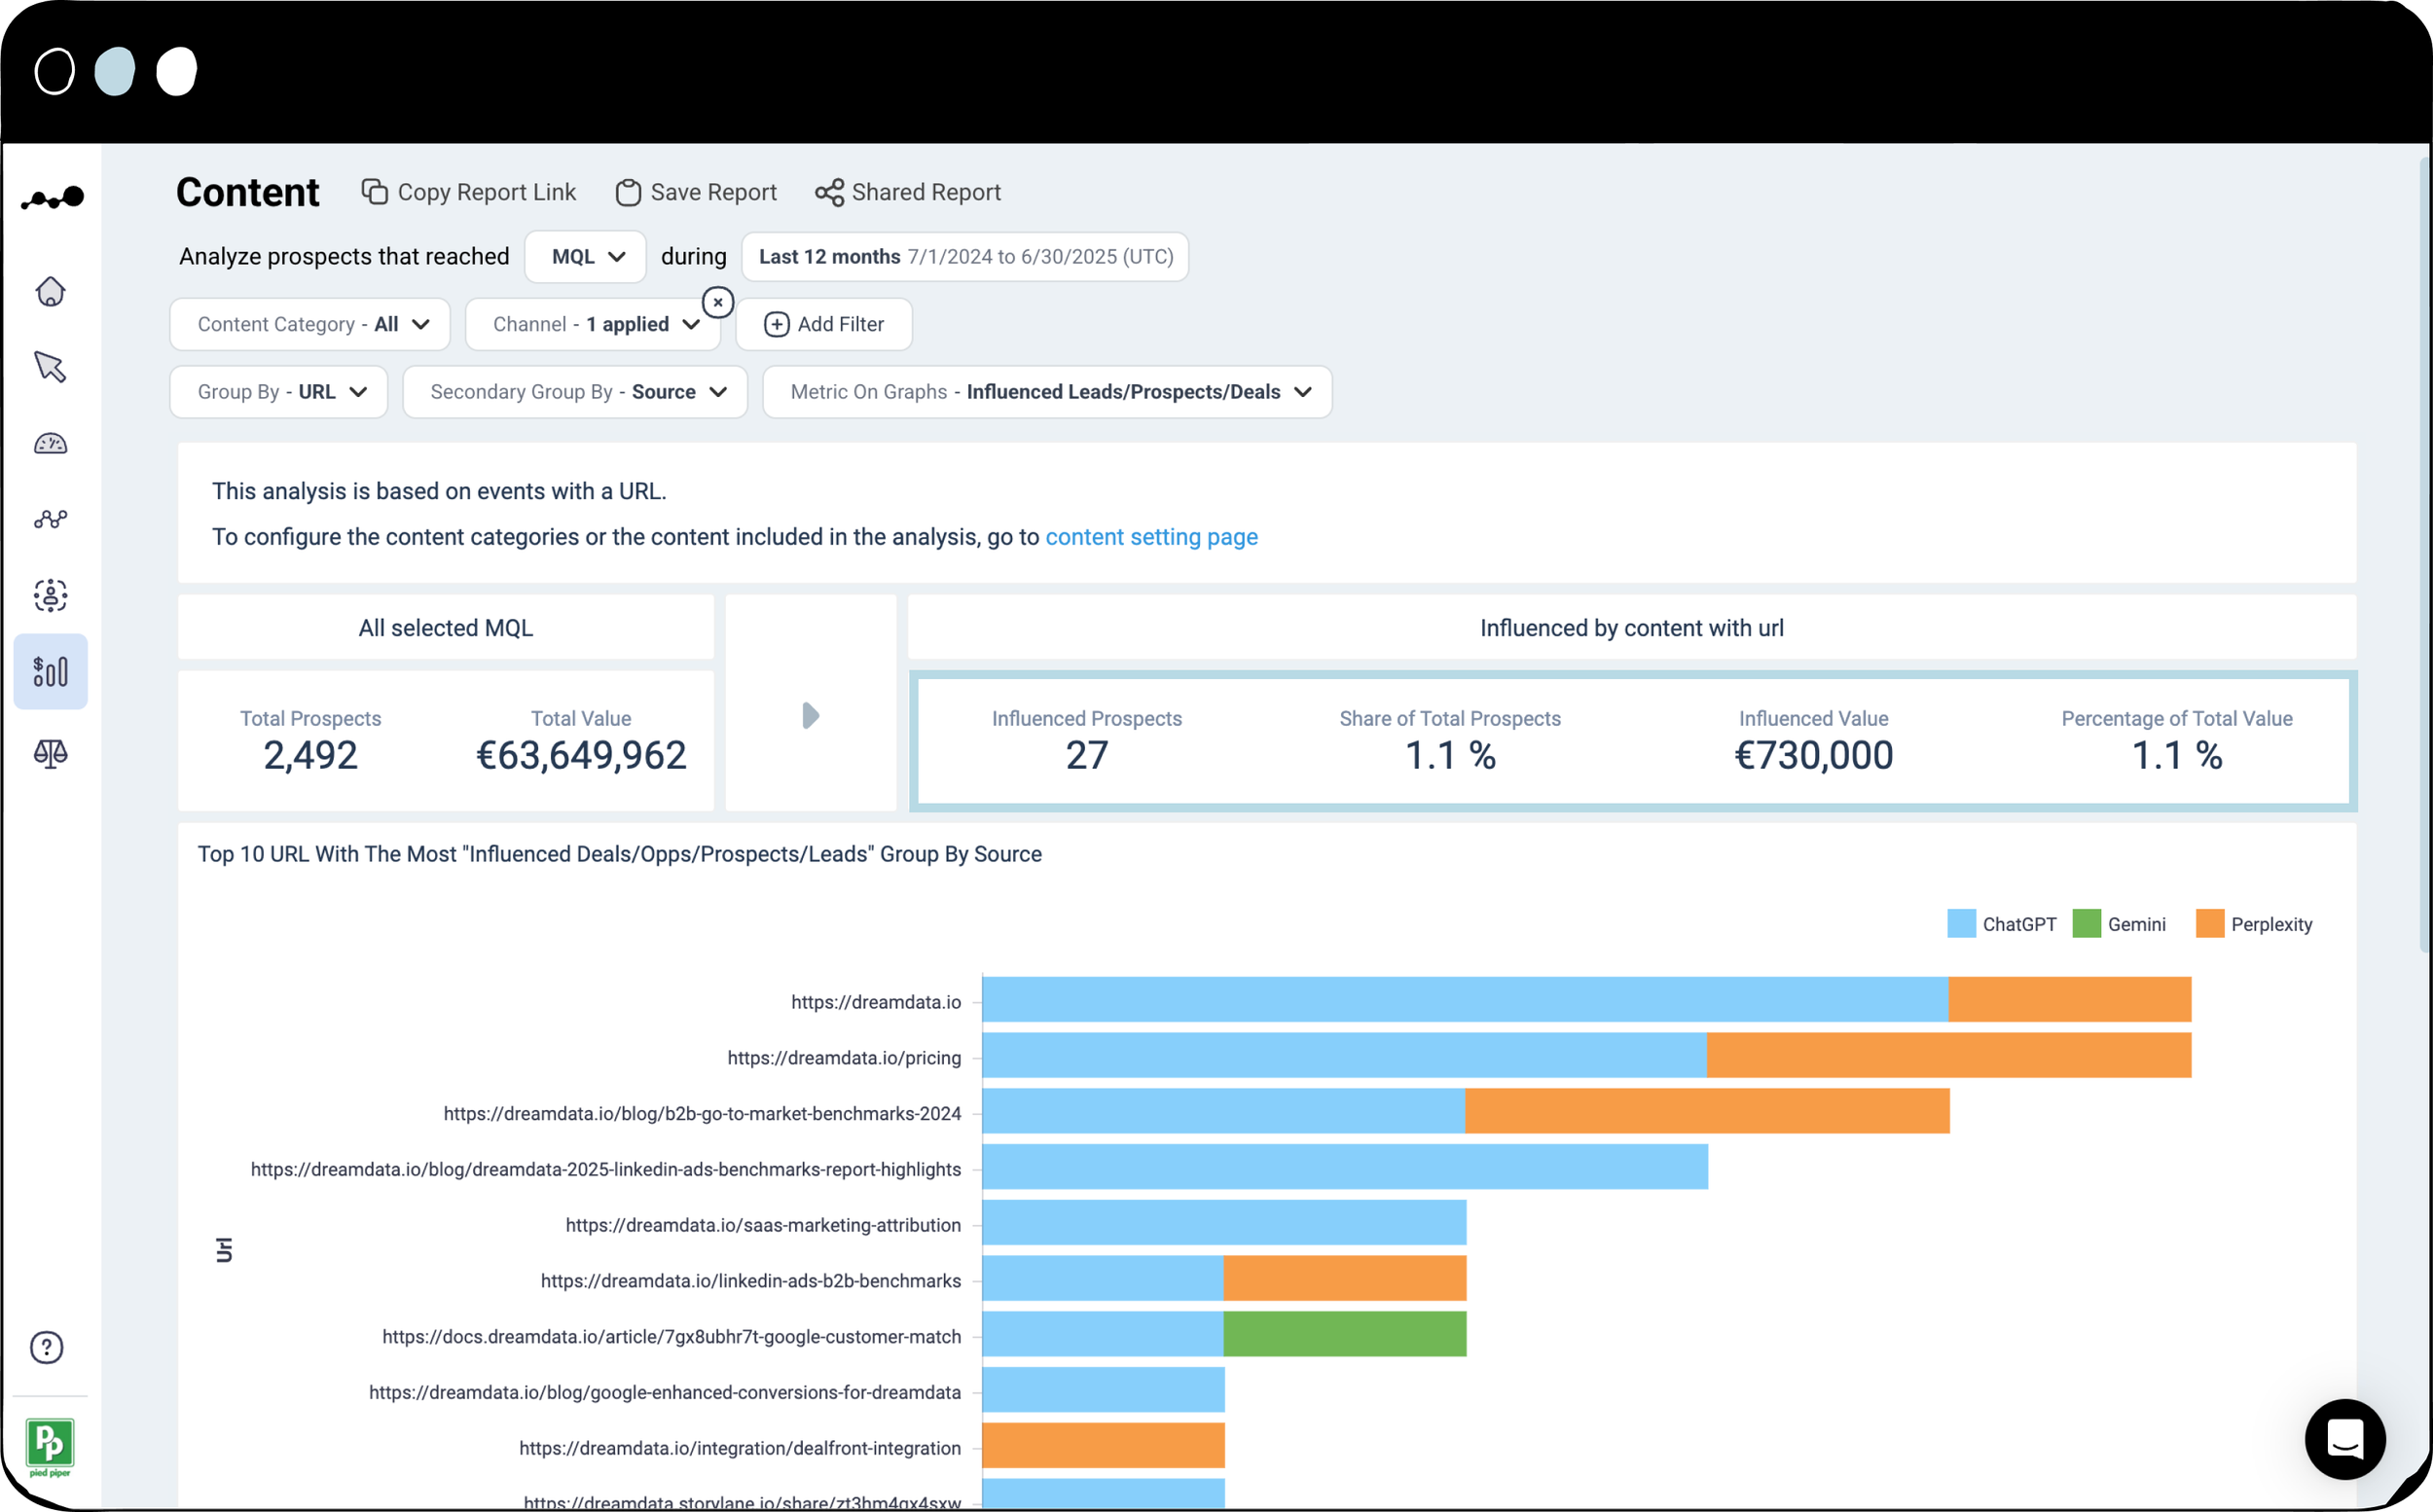
This reveals that only 1.1% of all MQLs in the last 12 months were influenced by content accessed via LLMs.
But if we instead analyze the NewBiz closed in the last 12 months, we can see that this jumps to 6.2%.
This indicates that content surfaced by LLMs has a higher impact on closed-won deals.
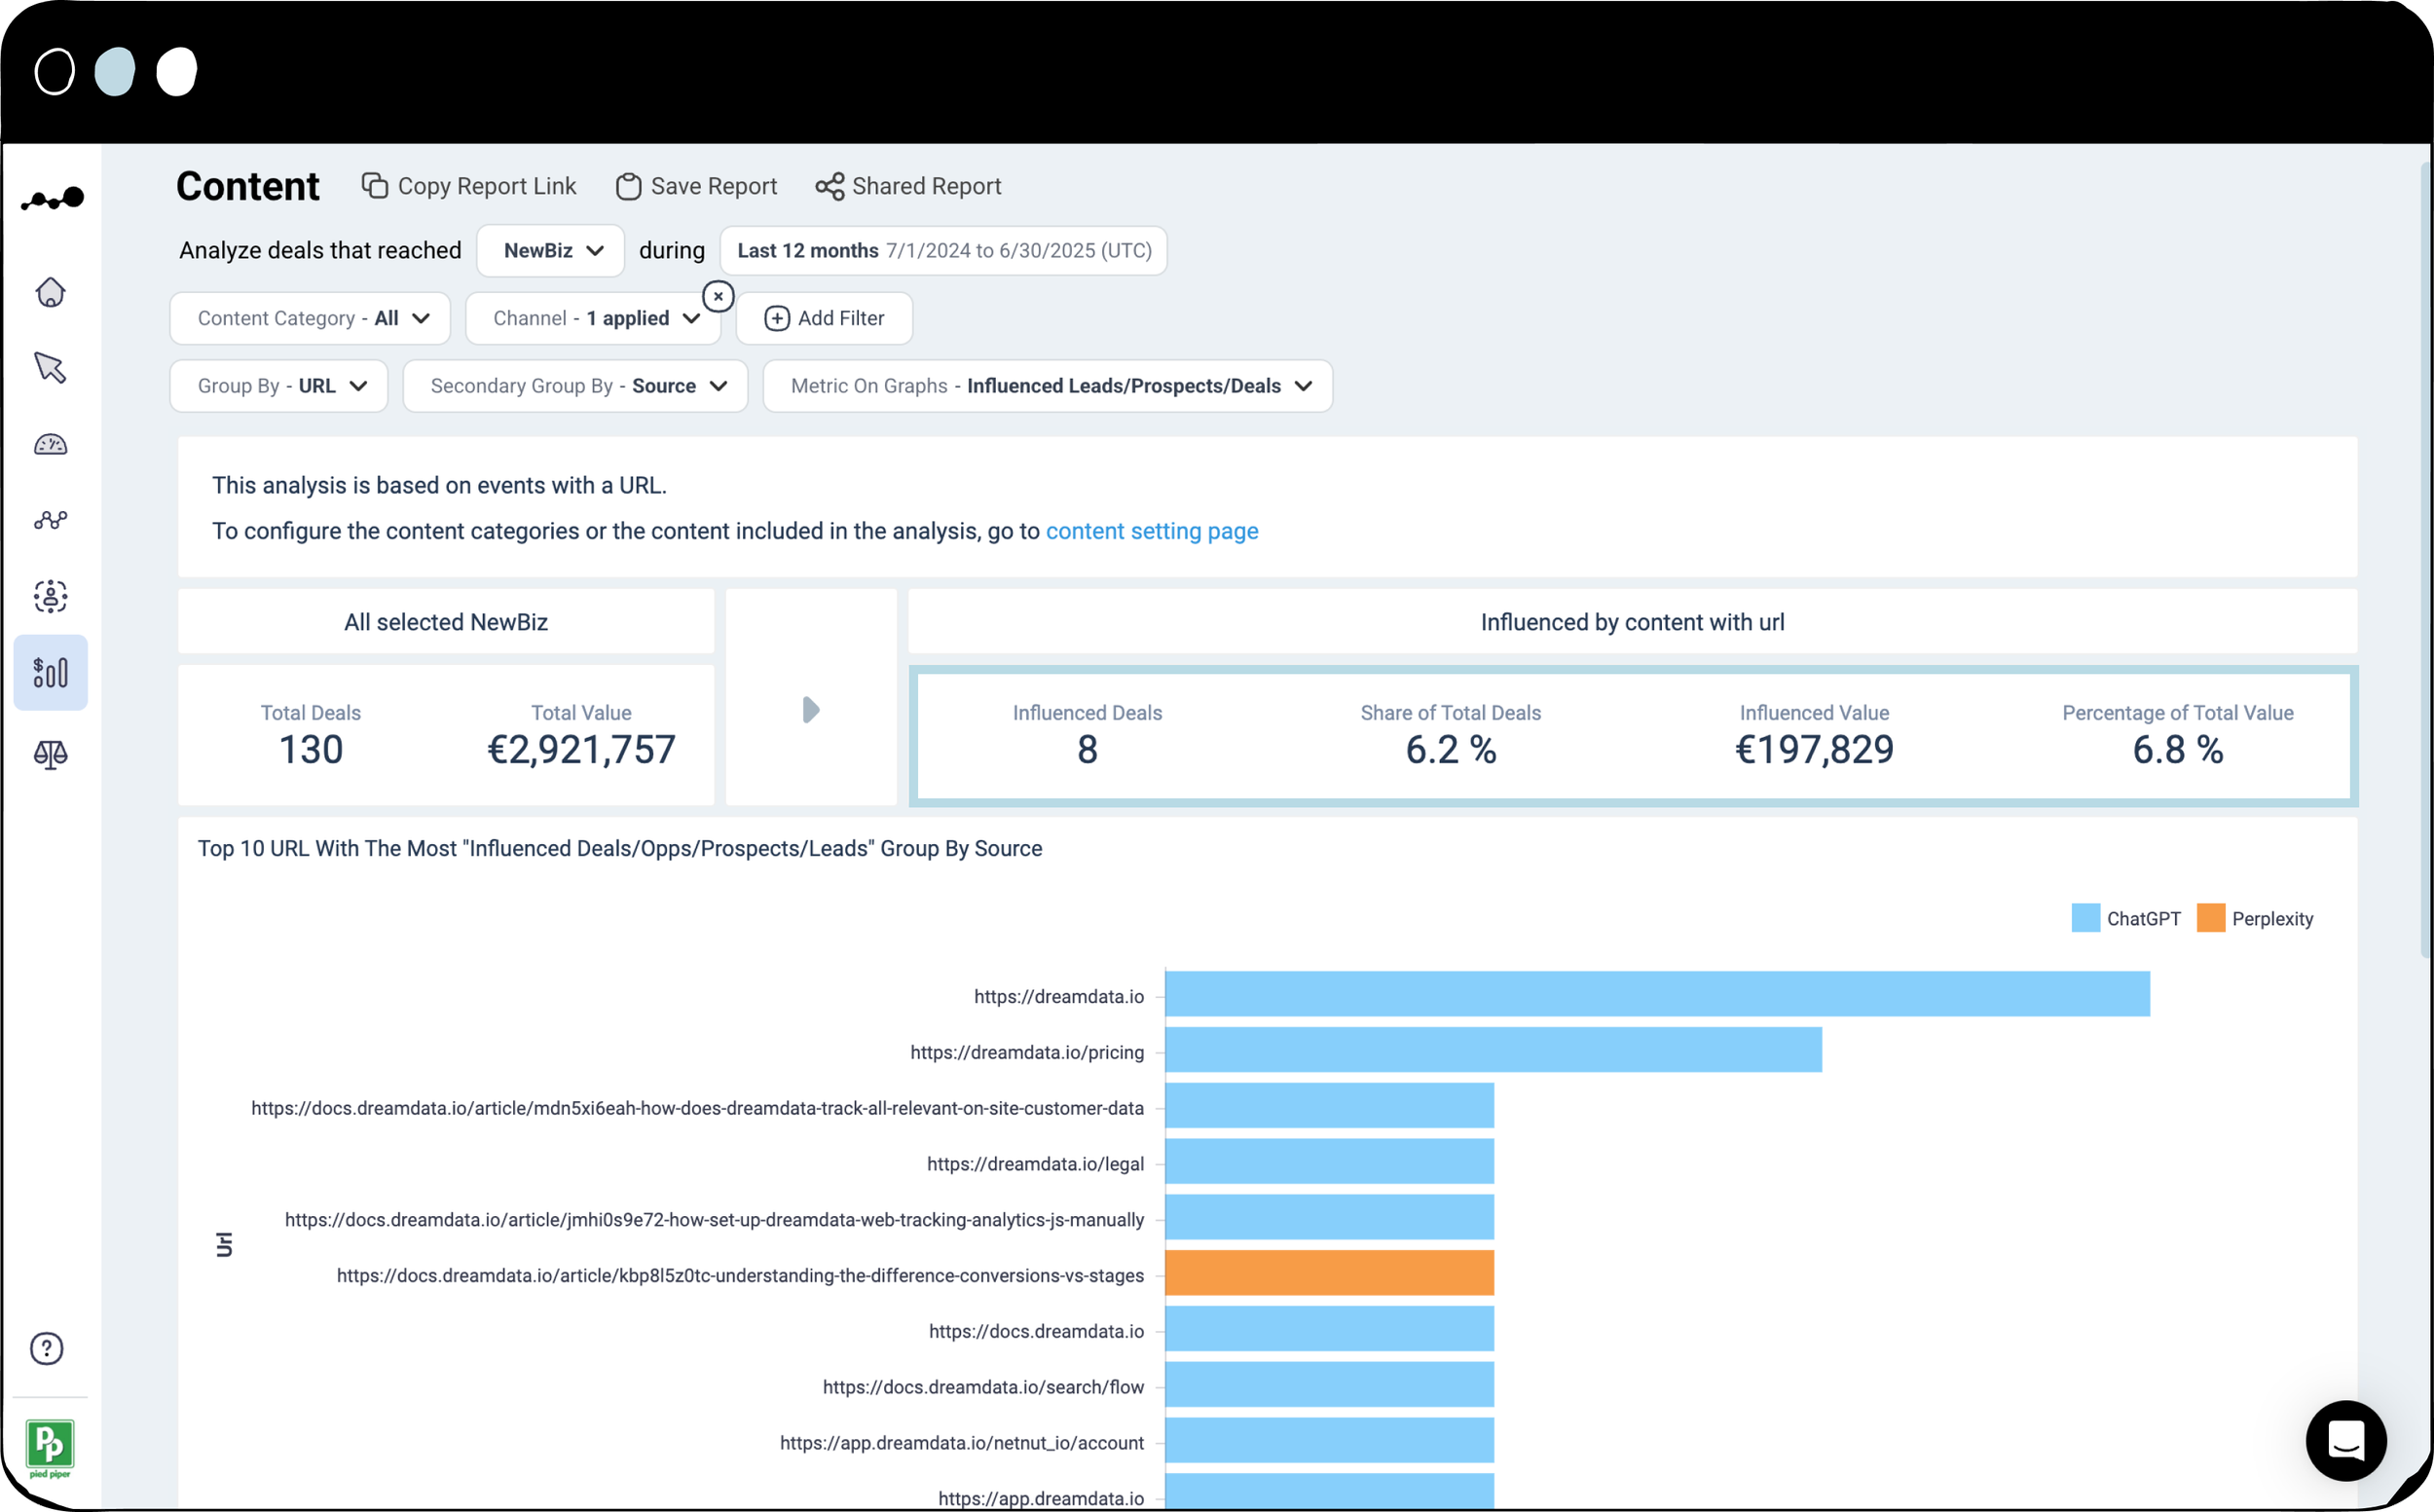
Let’s sort the ‘Performance Group by Source’ table by ‘Influenced Value’ to see which LLM-surfaced content had the highest influence on the NewBiz closed in the last 12 months.
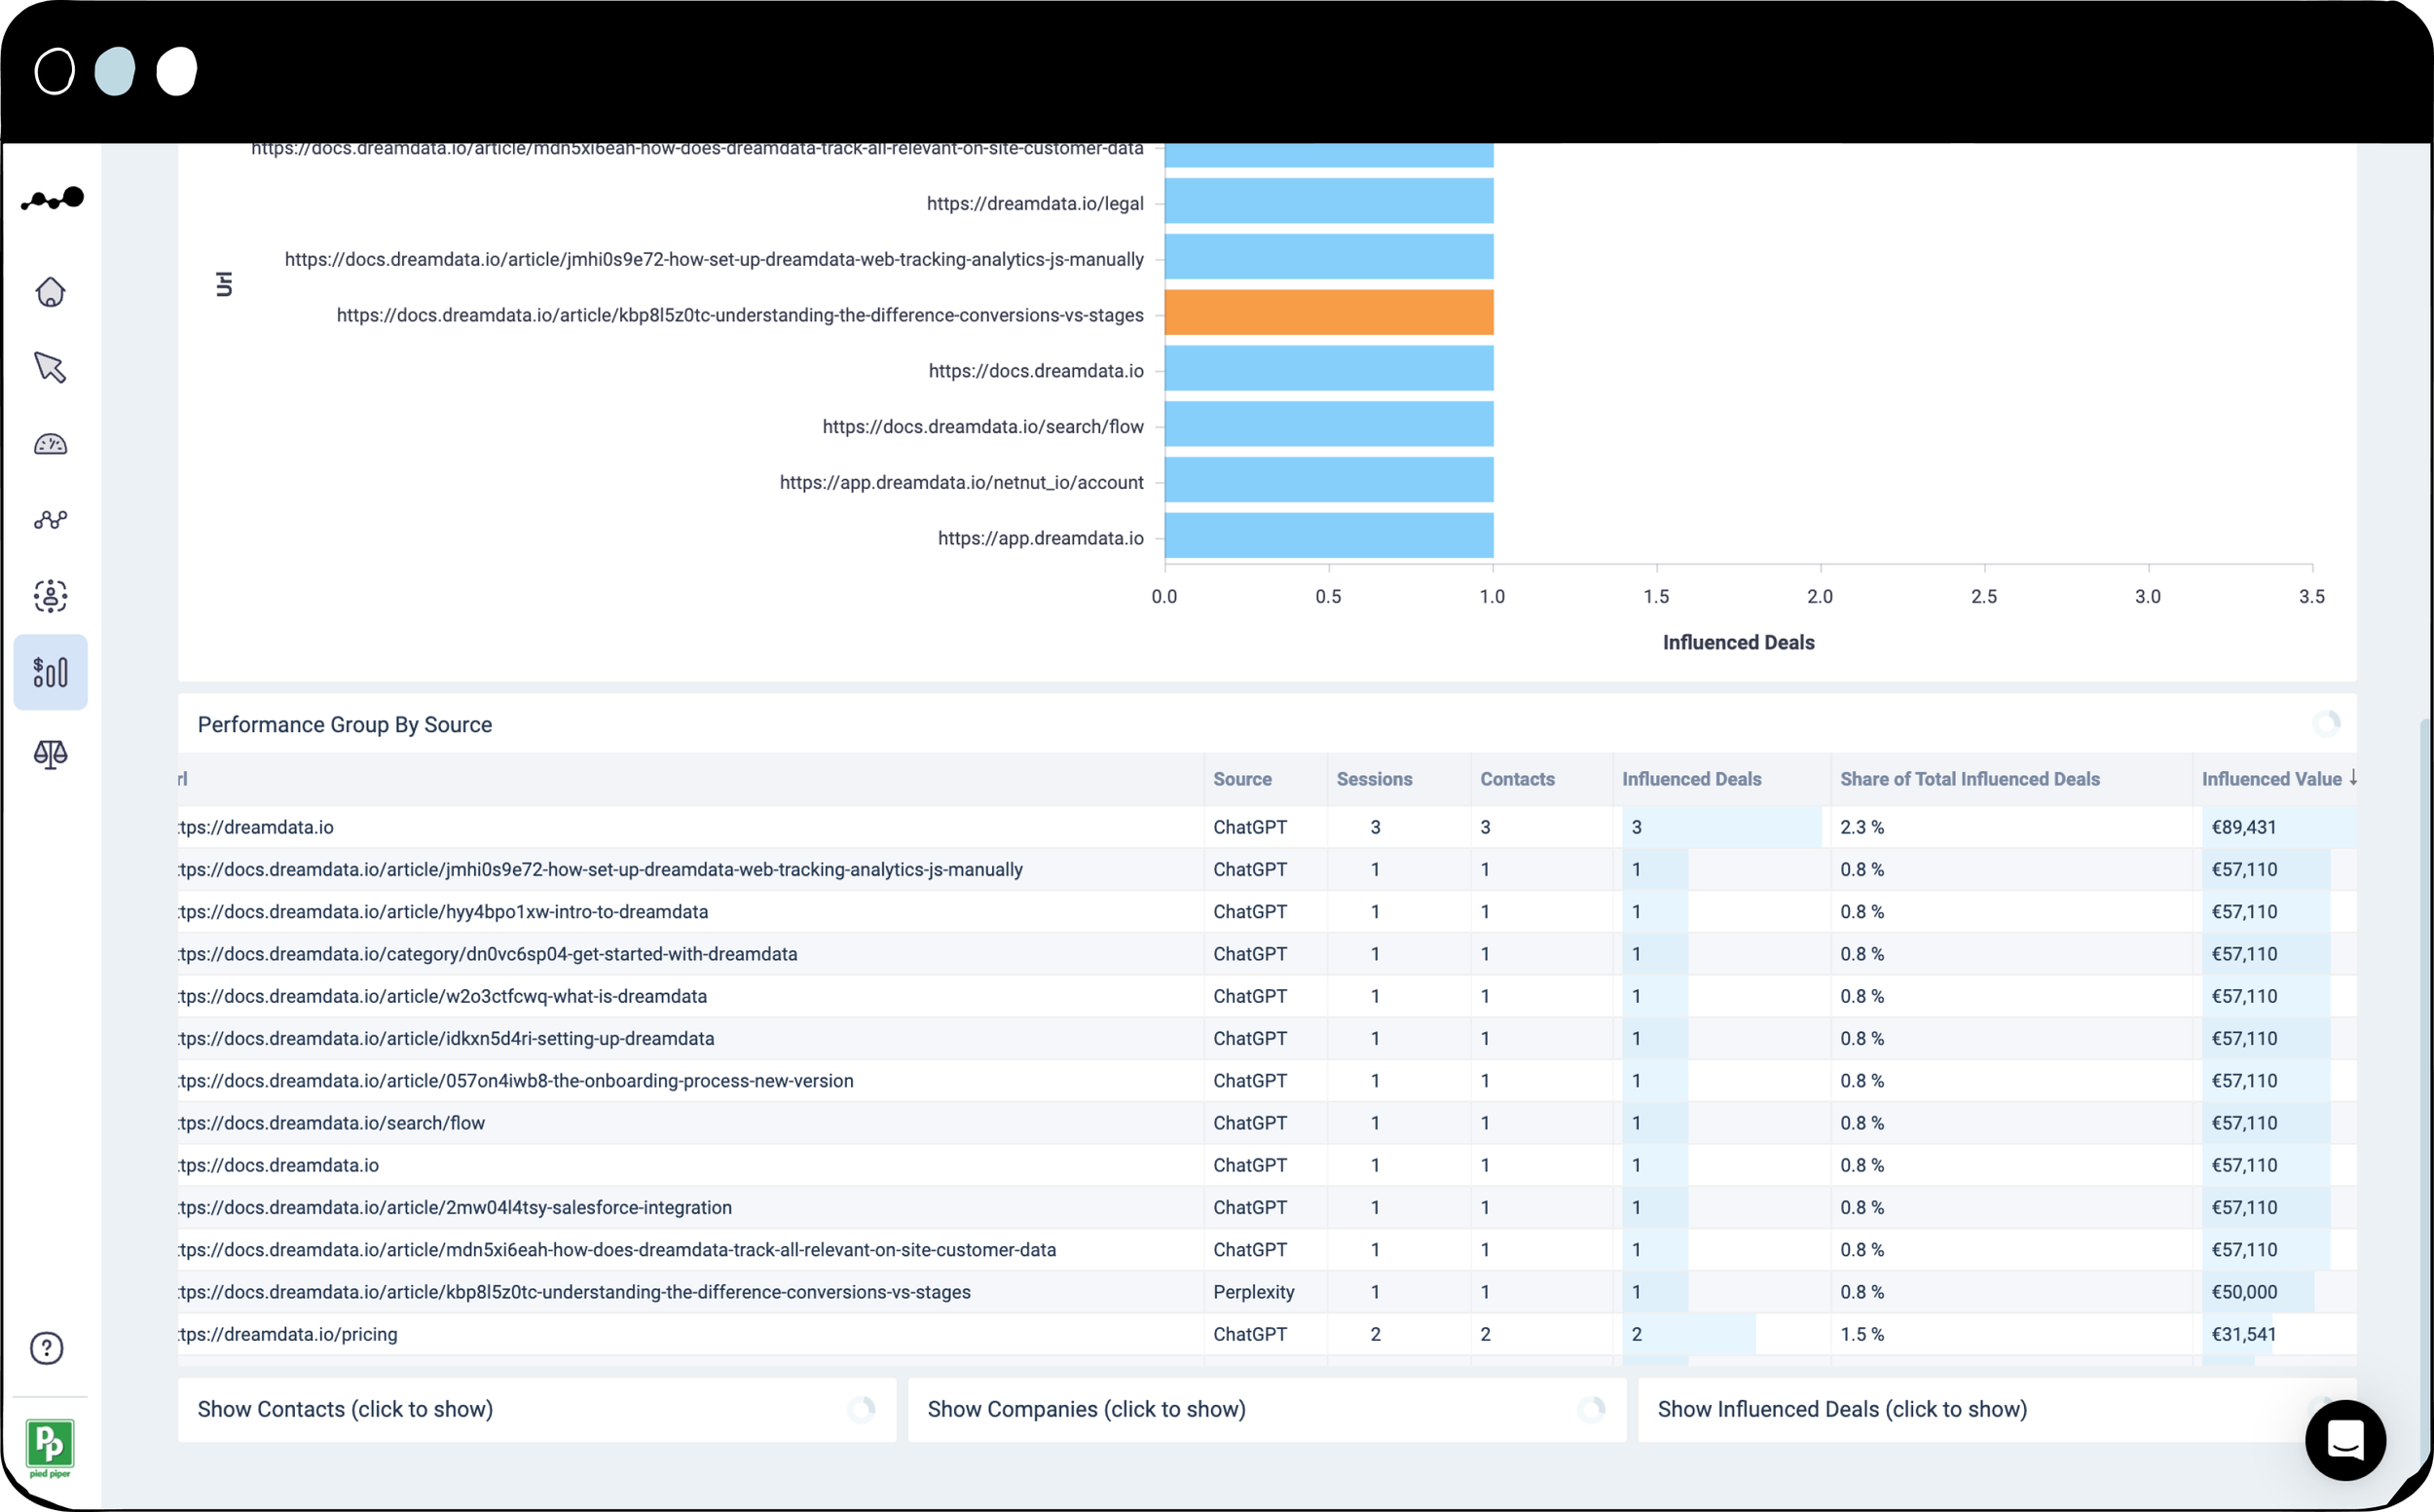
We can see that deals closed in the last 12 months were largely influenced by our help docs surfaced by LLMs.
More and more people are asking their questions to LLMs, instead of going to a product’s documentation.
So it’s important that our documentation is kept updated and sharp so it’s optimized for LLMs.
The shift towards LLM-driven research is reshaping how prospects discover and engage with brands, making it essential to adapt your content strategy to this new way of researching.
Dreamdata provides the necessary tools to track the influence of LLMs across your entire pipeline.