
B2B GTM Benchmarks 2024

B2Bs on average spend over 30% of their ad budget on LinkedIn Ads, the channel that offers the cheapest cost per influenced company of all major ad networks. For its part, Google remains the largest budget line for ad spend - with 53% - and the biggest source of web traffic.
You guessed it. We are back with a new edition of our B2B go-to-market benchmarks!
Following the success of our 2022 GTM Benchmarks report (which was updated in 2023), we have gone back to our customer data to examine what stories lie behind B2B go-to-market in 2024.
But we’re not stopping at this report. We are now making real-time benchmark reports available to all Dreamdata users, allowing you to access the latest benchmarks and directly compare them with your own data.
Find out more about how you can compare your performance to other B2Bs today →
About this report
This year’s benchmark report has been expanded to reveal more data on the activities B2B marketers run in their day-to-day.
Where are B2B marketers spending most of their paid budget? What channels are generating the most traffic? What is the average CPC for Google Search Ads? How many sessions are there in the average B2B customer journey?
In this report, we cover all the main findings from our data:
Find out more about our methodology in the ‘About the data’ section at the end of this report.
What do these benchmarks mean for you?
These benchmarks enable you to see how B2Bs are driving their growth, helping you succeed with yours.
By better understanding other companies’ performance across a wide range of metrics, B2B marketers and go-to-market professionals can compare decisions and answer questions about where to allocate budgeting, the length of the customer journey, and much more.
B2B Ad Budget Benchmarks
The B2B ad budget is the marketing game plan, it tells us where paid marketers place their growth bets.
But on what channels are B2B marketers actually placing these bets? Are you investing in the same channels? Are you overspending on others?

Spend on the Google Network (Search, Display, YouTube) accounts for over 50% of the paid budget.
The largest share of this goes to Google Search Ads, and in particular non-branded campaigns on the channel, with 39% of the budget.
The commitment to Google in favour of LinkedIn is curious from a B2B perspective, given the reduced control marketers have over the target audience consuming the ads, i.e. the size of the company. In B2B, company size is a hugely important criterion for ICP definitions.
LinkedIn dominates Paid Social taking a third of the paid budget - but still not dethroned Google Search.
Taking 32% of the ad budget reinforces the platform’s reputation as the jewel in the B2B paid social crown - with Facebook accounting for just 11%. However, it hasn’t been able to de-throne Google as the preferred paid channel overall.
This is despite LinkedIn running a considerably lower cost per company influenced (see more in the Ad Performance section below), and being the only network that provides complete control over the B2B audience size.
As mentioned above, B2B ICP definitions rest heavily on firmographic criteria, particularly company size - LinkedIn is the only ad network that allows you to directly control this.
Brands spend big to protect traffic - Branded terms on Google Search are 7% of total ad spend.
Branded terms are crucial for protecting your brand from competitors aiming to divert your traffic, often referred to as the “Google Tax.”
However, considering that this amounts to 7% of the total budget, it’s worth assessing if this investment is justified, especially if we consider that many of the clicks on branded ads would likely occur organically, without the additional spend.
We took a closer look at branded and non-branded performance in this recent study →
YouTube and Google Display Ads account for 4% of B2B ad spend.
These channels have traditionally been used for both broad-reach campaigns and retargeting, typically with the aim of increasing brand visibility rather than driving direct conversions. The budget data confirms that B2Bs continue to prioritize more direct-response channels.
Bing receives less than 2% of the ad budget despite growth in usage.
This is not entirely surprising given the search engine has historically held a very small percentage of the global market share, ranging from 2% to 6% between 2009 and 2020. However, since 2021, Bing’s market share has grown to 10.5%, and continues to grow in the wake of the ChatGPT integration.
This points to growing market opportunities on the search engine, especially when taking into consideration the relatively low costs and positive ROAS Bing ad campaigns generate (more in the next section). So it will be interesting to monitor this benchmark over the coming months and years to see if B2B marketers seize the opportunity or not.
B2B Ad Performance Benchmarks
Ad performance cost metrics are the leading indicators for B2B paid marketers. CPC, CPM, CTR, Cost per Lead, are all used by marketers to gauge their performance across ad networks. But how do these stack up against industry standards? And how do they compare against the Return on Ad Spend (ROAS)* generated?
What does a good CPC look like on LinkedIn? What’s the average CPM on Google Display? How does cost per influenced company compare against cost per influenced contact across the ad networks?

*NOTE: - The in-app Dreamdata B2B Benchmarks do not include Return On Ad Spend (ROAS) benchmarks, but every Dreamdata customer has access to their own ROAS numbers.
ROAS is calculated using data-driven attribution modelling on closed-won deals over a 12-month period.
LinkedIn offers the best cost per company influenced of the major ad networks - Google Search Ads and Facebook are both over 75% more expensive.
Our data disproves Linkedin's reputation as an expensive growth source for B2Bs.

While LinkedIn does have a very high cost per influenced contact (over 160% higher than Facebook and 60% higher than Google Ads) LinkedIn runs the lowest cost per company influenced of all the major ad networks.
Facebook and Google Search Ads are 76% more expensive than LinkedIn per company. This is especially important to B2Bs as the cost per company metric is, by definition, much more relevant for B2B go-to-market.
The distribution of cost per company influenced is also much narrower on LinkedIn than the other ad networks, meaning that when you are acquiring companies at the upper end of cost, it is still 2x cheaper than the upper limits of Google Search Ads.
Finally, LinkedIn Ads also generate the best ROAS of the three major ad networks, with 113%, which also makes it the only network to generate a positive return.
Facebook generates only 29% Return on Ad Spend, the poorest return of the major ad networks
From our data, we see that Facebook Ads, while cost-effective in terms of CPC and CPM, show a low efficiency in terms of ROAS and CTR.

Google non-branded Search Ads generate a ROAS of 78%.
Despite taking the largest slice of the ad budget (39%), non-branded Google Search Ads generate a ROAS of <100% and run a high cost per influenced company.
This suggests it may not be as cost-effective in acquiring B2B customers compared to other channels. This underscores the need to constantly monitor and compare channel performance in terms of pipeline and revenue generation to ensure you’re putting your money where it makes the biggest impact (see how easy it is to do this with Dreamdata here).
We took a closer look at branded and non-branded ads in this recent study →
Google Display Ads generate the best cost per company influenced from the Google Network.
Google Display is one of the biggest surprises in our analysis. Not only do Display campaigns operate more efficiently in terms of costs compared to the other channels, especially cost-per-company and cost-per-contact influenced metrics, but the channel also runs a high ROAS.
It’s possible that many of these are retargeting campaigns, which we can safely assume drive a better return, as there might already be some buying intent.

B2B Customer Journey Metrics Benchmarks
Time-to-revenue (or to-conversion), is one of the most underestimated metrics in B2B marketing. It enables us to track how long it takes from action X to outcome Y.
Traditional tracking methods, like those from Google and Facebook, fail to capture the extended length of customer journeys typical in B2B. This leads to premature judgments about the effectiveness of growth activities.
Understanding how current investments translate into future revenue is key to setting realistic budget targets, experimentation and improving your go-to-market strategies.
How long is the average B2B customer journey for SaaS? How do your funnels compare, are they faster or slower than the industry standards? How many touches do accounts have on average before crossing the line?
Customer Journey length from first-touch to closed-won 192 days on average.
As we showed in our 2022 customer journey benchmarks, the average B2B customer journey stretches over 6 months from the first anonymous touch to closed-won, 192 to be exact. In exceptionally complex journeys, the process can take over 12 months. This highlights the need to set longer horizon plans for your strategies and underlines the need to give experiments the necessary time to bear fruit.

Average time in sales pipeline (SQL to Closed Won) is 95 days.
Looking specifically at the sales pipeline benchmark, we see that this stretches for 95 days, a statistic that will do little to calm our Sales colleagues’ impatience.
On average, there are 62 touches across at least three channels before a B2B deal is closed.
It’s not just time. Our data shows that companies are very busy throughout their prolonged customer journeys, with 62 sessions over an average of three channels.
There are 6.3 stakeholders involved in B2B buying journeys on average.
Our analysis highlights just how many stakeholders are involved in B2B customer journeys. This emphasises the biggest distinction between the B2C and B2B buying process, where the individual wanting your product is rarely also the holder of the purse strings.
You can find our B2B GTM Benchmarks report here →
B2B Web Traffic Benchmarks
Web traffic is the go-to leading metric for understanding the success of your efforts in driving potential opportunities to your digital real estate. Whether you’re looking into SEO or performance marketing, traffic is your leading indicator.
But how do you compare with other B2B companies in your industry? How do you know if your numbers are good? Are you generating traffic from the same sources? Are your SEO activities bearing as much fruit as others? Is your paid traffic as high as it should be?
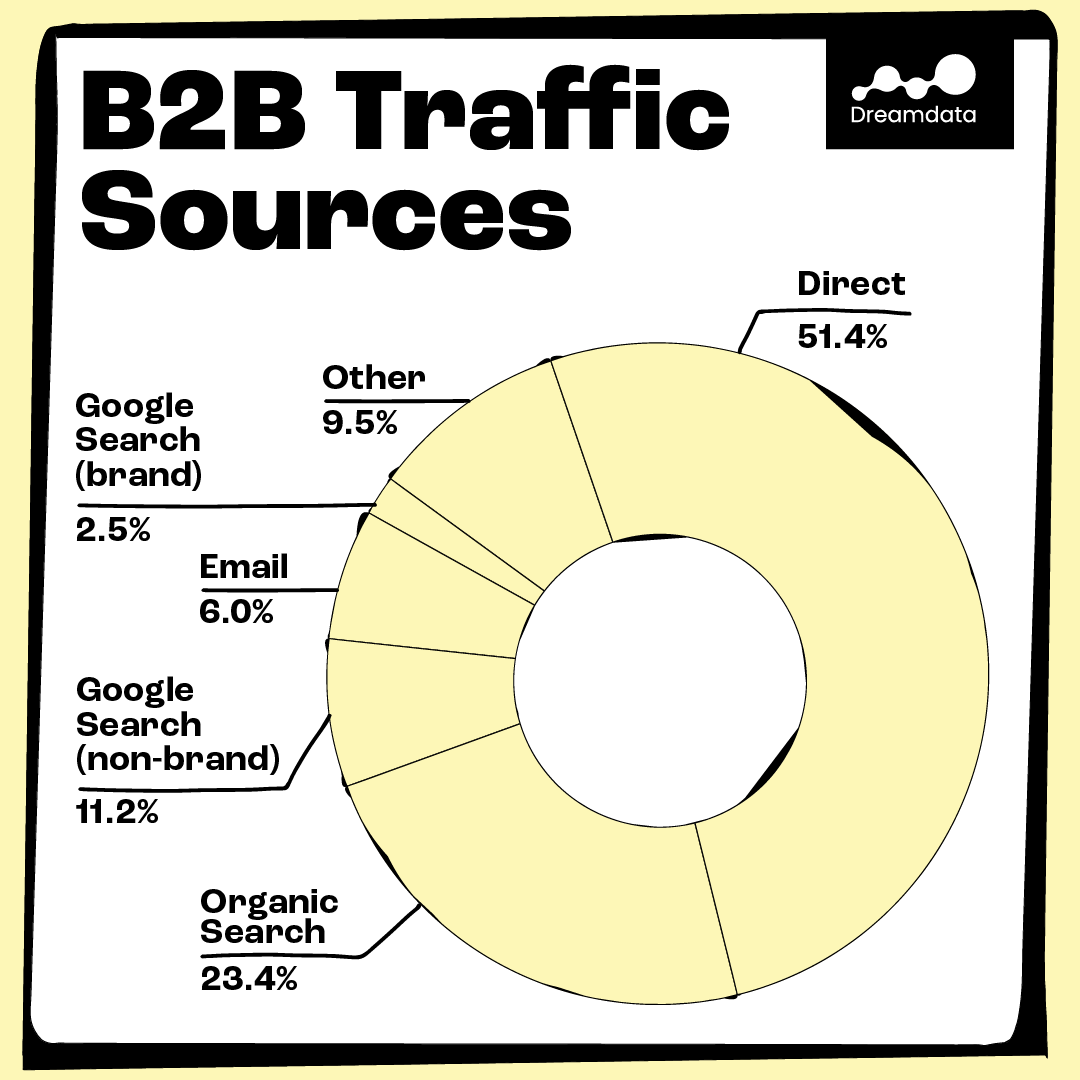
A strong brand matters: Combined, direct traffic (51.4%), organic search (23.4%), and branded search traffic (2.5%), indicate that a substantial portion of web traffic is addressable to the brand.
This aggregated figure of 80% indicates that a majority of the traffic is due to brand recognition and demand generated by other marketing efforts.
SEO is not dead: Google Search (Organic and Search Ads) accounts for 37% of traffic
Of this, organic search traffic is the largest tracked contributor among identified sources, accounting for 29% of total traffic. This highlights the strength of SEO and the effectiveness of content marketing strategies in attracting potential customers to the site.
How does your Organic traffic compare? Do you need to double down on your SEO? Compare your traffic instantly now with Dreamdata B2B Benchmarks →
Despite accounting for 39% of the ad budget, non-branded Google Search Ads drive only 11.2% of traffic. Considering Search Ads’ role in demand capture, this discrepancy between investment and traffic raises questions on the need for optimization or even reallocation of the budget towards more effective channels.
Social channels drive only 2% of traffic combined.
Despite a collective ad spend of 42% of the ad budget, Paid Social is not a significant traffic source - which agrees with the low CTR set out in the Ad Performance section above. Both LinkedIn and Facebook underdeliver here, driving only 2% of traffic.
However, how many of these efforts play a role in brand awareness which then see visitors land on the site through other sources? A question which forces us to ask whether or not traffic is necessary or even useful to track impact.
How do you compare? Get started with Dreamdata Benchmarks
Dreamdata Benchmarks enable you to compare your B2B performance with industry benchmarks instantly - a first of its kind in the B2B space.
The four reports are a strategic tool that enables B2B companies to assess their performance, set goals, drive improvement, and stay competitive in their respective industries.
The best thing is that you can access these reports as soon as you sign up to Dreamdata and set your stage funnels - and the Ad Performance and Ad Budget reports are available on our Free plan!
A word about the data
The data used to compile these benchmarks is anonymised aggregated data* taken from all Dreamdata customers (who have not opted out of the Benchmarks).
To make the Benchmarks as accurate and reliable as possible, our methodology has been as follows:
Normalizing the data to allow a fair comparison among accounts with different advertising spend.
Only including accounts with a minimum spend to avoid non-representative data.
Using median and quartiles to remove the influence of outliers that might skew the metrics.
Aligning definitions for the funnel stages through a setting that everyone can set up inside our product.
ROAS is calculated using data-driven attribution modelling on closed-won deals over a 12-month period.**
You can read more about how Dreamdata pulls and enriches data on industries, size, etc here. And about tracking more generally here.
* At Dreamdata we take data security and privacy very seriously. Dreamdata has processed only non-PII data for this study. The data insights are aggregated, and a minimum number of data points (accounts) has been introduced for every benchmark meaning it is not possible to identify individual companies. Only data from companies that have agreed to let us use data in benchmarks are included.
**The in-app Dreamdata B2B Benchmarks do not include Return On Ad Spend (ROAS) benchmarks, but every Dreamdata customer has access to their own ROAS numbers.