
8 things you can do with Content Analytics

This post was originally published March 2022
In this post, we’re covering 8 use cases for our Content Analytics product that’ll help you make the most of your content data.
Dreamdata’s Content Analytics dashboards have been designed to measure your content’s performance in metrics everyone can understand: pipeline and revenue.
Thanks to our end-to-end tracking of the B2B customer journey, we’re able to track the influence of your content on accounts as they move through the pipeline.
By connecting content to revenue, Content Analytics opens up a world of opportunity for any B2B marketing team pushing content.
Just see how it’s helping Nils at 24Slides 👇
In this post we’re going to show you 8 things you’re able to do with Content Analytics:
Find which content is influencing pipeline and revenue
Test your content funnel
Compare and optimise your content
Identify what source channels work best for different content.
Content Segmentation by role, industry, deal size, company size etc.
Account-based content marketing
Lead scoring based on content viewed
Product-led growth, product analytics, and product-qualified leads
So let’s get to it then, shall we?
1. Find which content is influencing pipeline and revenue
Say you’ve been asked by leadership/management to give an overview or report of content performance over the last quarter.
With Content Analytics you no longer have to fumble over which KPIs you’re going to be reporting - traffic, downloads, sign-up conversions, the usual suspects. Instead, you can provide direct evidence of content influence at each pipeline stage and on revenue.
In the Content Analytics dashboard, you’ll find the headline percentage of content-influenced leads/opportunities/deals and revenue.

In our example, we can see that content influenced 57% of all new deals, and 60% of revenue over the last year. Where a total of 72 customers engaged with content at some point in the account’s journey.
For this analysis, you just have to set your date range and desired pipeline stage (your pipeline stage will tell you how many leads have been influenced by content up until that point in the pipeline).
Then add whichever filters apply to your query. We’re only applying filters on our content categories, as we’re focusing only on content-specific URLs, e.g. Blog.
See here to learn how to set up content categories.
2. Test your content funnel
So far it’s been nigh on impossible to test your content funnel assumptions.
Chances are you’ve been creating content to cater for each level of the funnel. Whether that’s awareness-building infographics, thought-leadership blog posts or sales enablement product videos.
But are thought-leadership TOFU posts capturing leads/ generating demand as expected, or are they actually performing better BOFU? Are your product videos being watched further up the funnel?
Again here, the Content Analytics dashboard offers insights into whether your content is performing at the stages you expect it to.

Once you’ve set your date range and selected the content categories you’re focusing on, you’ll simply have to switch between stages and observe the changes in the table.
Are you seeing those TOFU URLs making an impact in the earlier stages of the journey? Are there any other patterns you can spot?
In our analyses, we noticed that our integration URLs were more important higher up in than funnel, whereas they were initially designed for MOFU and BOFU. We’ve now adjusted accordingly.
3. Compare and optimise your content
For the content marketer, it's necessary to be able to compare the performance of content (across all types) against the same benchmark. This helps identify what content or content type needs to be optimised, scaled or even scrapped altogether.
Typically, conversion rates have been a good barometer of well-performing content and a signal for potential. For example, a URL might have low traffic but high conversion rates, meaning you could pump more paid traffic to the content or try boosting SERP ranking organically.
But conversion rates suffer from not being able to show what happens beyond the conversion. Do those signing up go on to become customers?
In our Content Performance dashboard you’re able to compare content performance based on ‘conversions’ by pipeline stage - a metric we’ve labelled Influenced Leads per Session.
There is a ‘Performance’ column which easily alerts you to the URLs with best performing Influenced Leads per Session to facilitate identifying those which might benefit from more traffic. Conversely, those with Poor performance might need optimising by, for example, refining the tone/subject to better meet the target audience.

4. Identify what source channels work best for different content.
Another relevant question B2B content marketers ask is whether content performs differently depending on the channel?
That is, does the traffic coming from Google Ads to my top URL influence as many leads as the traffic coming from organic to the same URL?
In fact, by adding a channel grouping you can also test if paid ads really work for blog posts, or if you should spend more time on video SEO.
And of course, this analysis also helps us pump (the right) traffic to the content with high Influenced Lead per Session we found in our previous use case. You can now find the channels, find the campaigns and scale them.
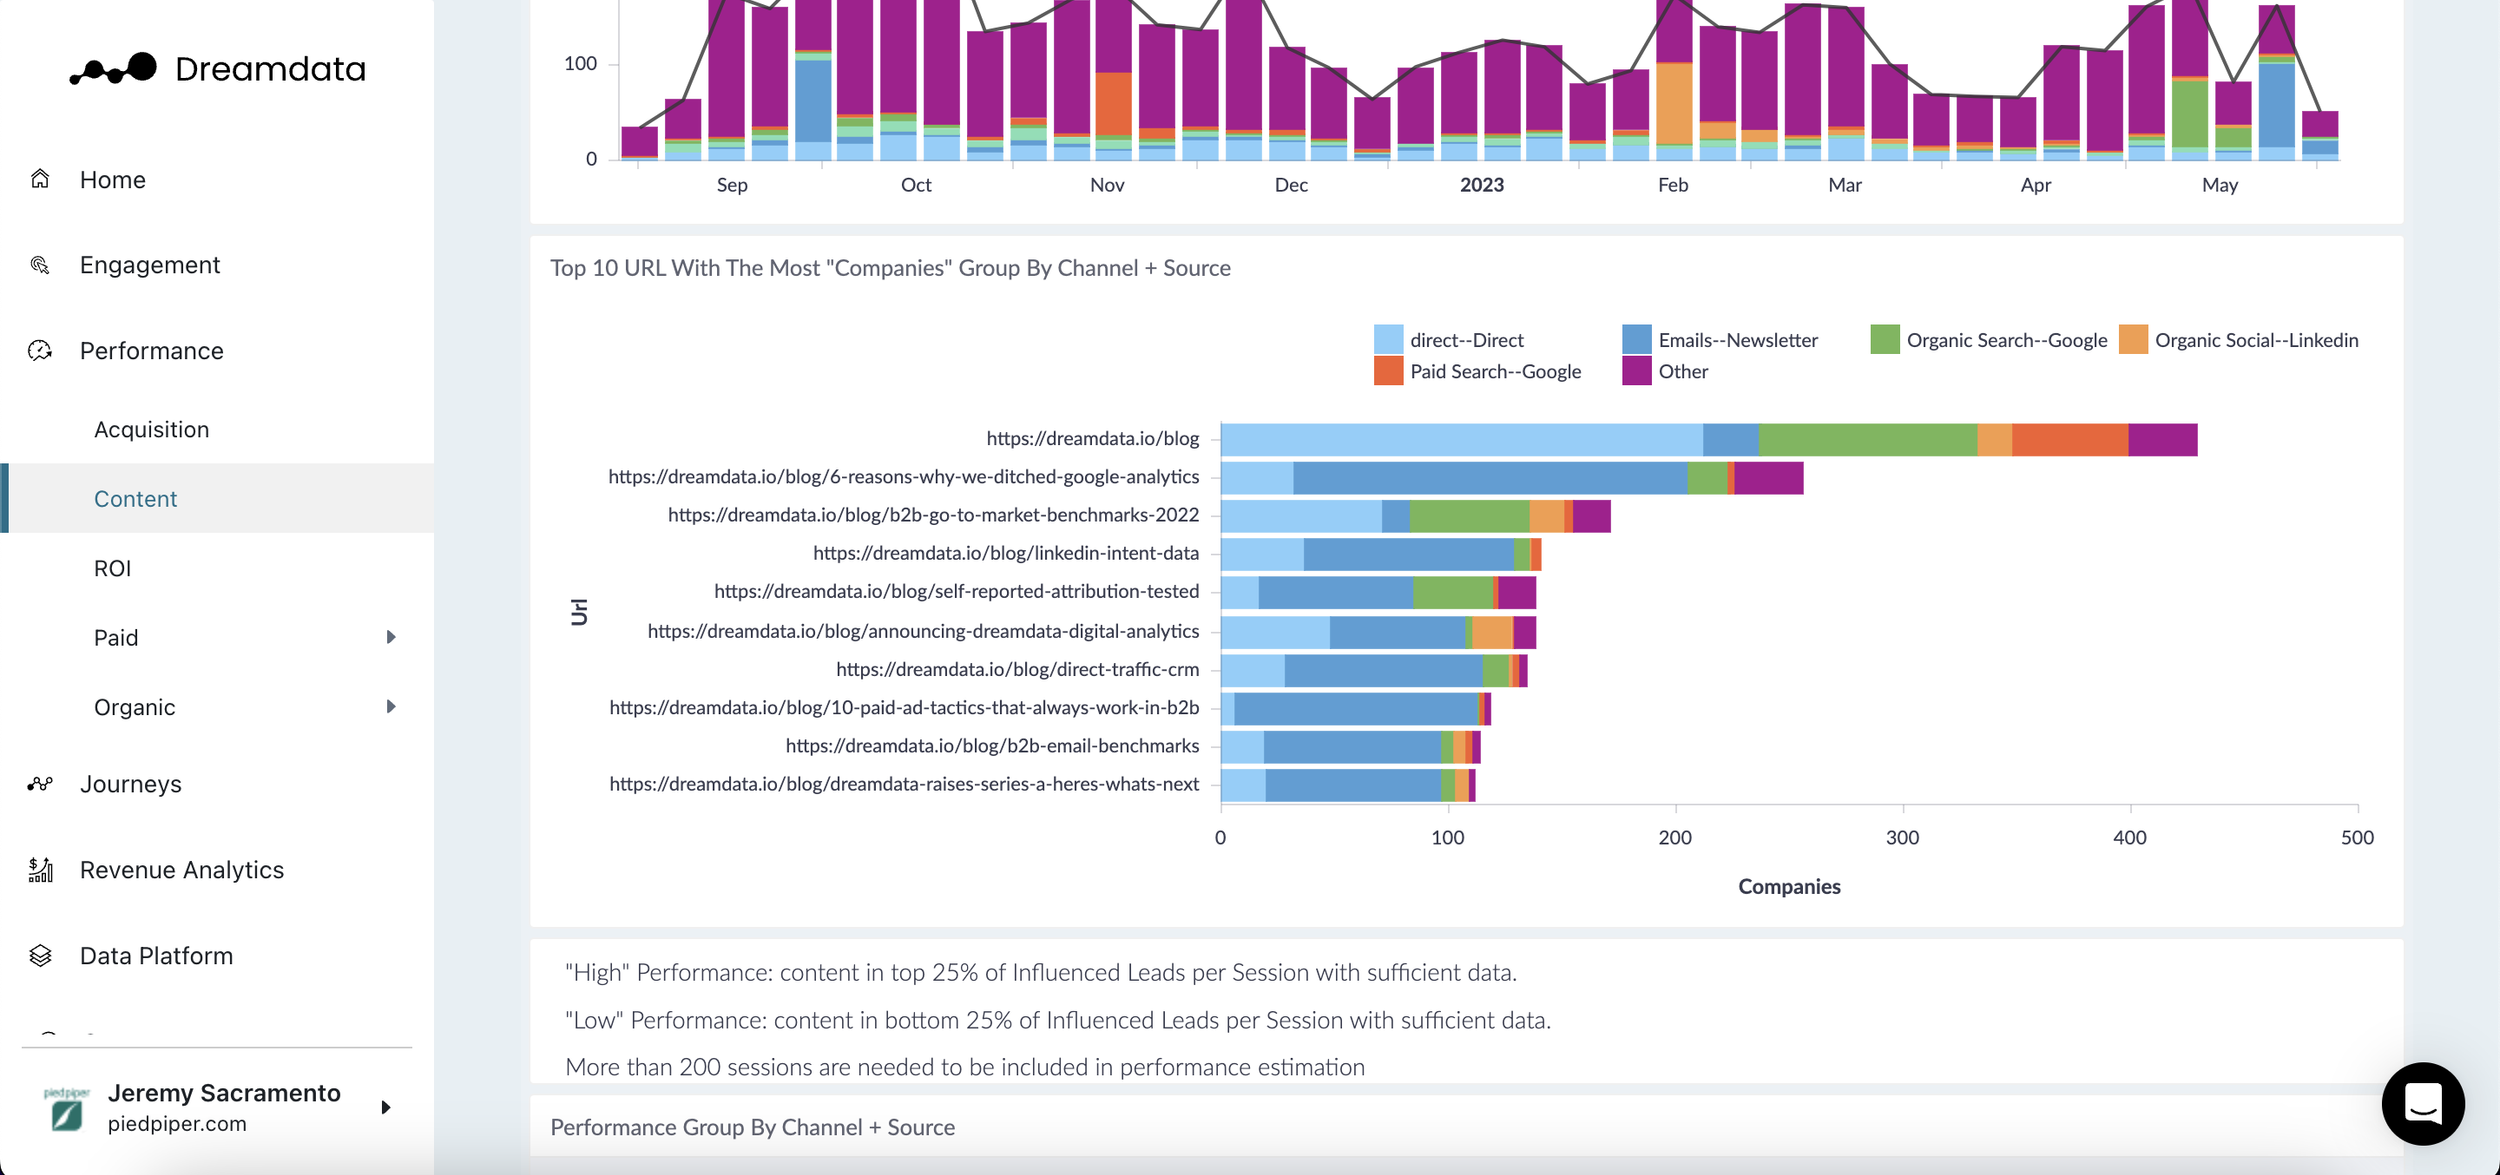
Here we chose the Secondary Group By filter to Session Channel so we can split each URL by the channel of the session where the content was viewed.
This same analysis can be run on the source, campaign, referrer or landing page of the session, set the Secondary Group By option to the desired split.
5. Content Segmentation by role, industry, deal size, company size etc.
Does company size matter for who consumes your content? Do higher paying customers view different content than those on lower tiers? Does country impact content preference?
These are important questions that can help plan and deliver your content. Knowing who your audience is can be the difference between success and failure. After all, what good is awesome content if the ideal audience for that item isn’t being targeted?
Dreamdata allows you to gain insights into your content audience segmentation, so you can nail your content delivery.
The influenced Contact/Company reports in the Content Performance dashboard offers a number of segmentation analytics, including Industry, country, revenue and employees (+ jobtitle and seniority in the Contact report).

You can read more about using Content Analytics to build your audience in this post.
6. Account-based content marketing
ABM is almost always associated with running campaigns on paid channels. Yet Content can (and should) also play an instrumental role in bringing your ideal accounts down the funnel.
From personalised landing pages to sending relevant content to accounts at specific intersections in the buyer journey, content is a great ABM tool.
Whether or not you’re already using content in your ABM, Content Analytics can help make content a part of your ABM campaigns by:
Targeting personas with the right content - Once you know what the ideal contact is for each content type (see Content Segmentation above), you can target these individuals within the account with content you know they’ll like.
Identifying where accounts are in their journey - Once you’ve tested your content funnel (see use case 2 above), you can use Dreamdata’s Journeys dashboard to find where your target accounts are in their journey and what they’re up to.
Build winning landing pages - If you know what landing pages have previously influenced pipeline and revenue (see the first use case above), and then segment these by industry, you can much more easily tailor your landing page for your targeted accounts.
For Account-based content marketing, you’re going to be mostly using the Influenced Contacts/Companies reports on the Content Performance dashboard. This will show you every contact (individual user) that interacted with the content.

7. Lead scoring based on content viewed
As we’ve already shown, some URLs feature consistently in successful customer journeys. This makes them ideal signposts for flagging leads that are worth paying special attention to.
Although not strictly a content marketing use case, using content views as part of your lead scoring setup can be immensely useful.
After all, if a sales rep knows that 80% of all paying customers read X blog post at some point in the buying process, it’s a pretty safe bet to spend time chasing leads who’ve opened that post.
Dreamdata enables you to do this easily, both on the product or through accessing the data directly and running the analytics externally - find out what you can do with Dreamdata data here and here.
If you’re using the product you should start by knowing the content that features in successful customer journeys (rewind to use case 1) and then filter through companies on your pipeline using the Journeys dashboards.

8. Product-led growth, product analytics, and product qualified leads
Seeing what product pages customers (especially free or lower tier) are using can help evaluate whether these are ready for upselling. Much like with Lead Scoring, this can then mean devoting time and effort to those accounts that are most likely to buy.
Not to ignore the content side of things completely, this is also useful for wiring content into any upselling activities. Say you’re targeting a free user to move them onto a paid tier. Knowing what product features they’re using enables you to target them with highly relevant content.
Product writers dealing with documentation too can benefit from this. As knowing what features are most in use can help prioritise documentation tasks.
Further outside the content realm, anyone curious about (web-based) product use, say for product analytics or qualifying PQL (product qualified leads), can make use of Content Analytics’s insights.

Ready to hit the ground running
Dreamdata’s Content Analytics is a game-changer for B2Bs. It finally enables marketers to measure the performance of content in metrics everyone understands: pipeline and revenue.
But Content Analytics is much more than just discovering the value of your content - important as that is.
In this article, we’ve shown you 8 distinct use cases for Content Analytics, which will make you do better and more with your content than ever.
From testing your content funnel to wiring content to your ABM, you’re now ready to hit the ground running.
Start your Content Analytics journey today 👇