
New Feature: Dreamdata B2B Benchmarks - compare your performance against industry standards
Did you know B2Bs spend over 50% of their ad budget on the Google Network?
Or that on average the cost per company influenced is 43% less on LinkedIn than Google Search Ads?
We’re extremely excited to announce Dreamdata Benchmarks, a first-of-its-kind, in-app B2B go-to-market benchmark report (and one of the top requested insights from our existing customers!).
Say goodbye to searching the web for years-old, one-off, benchmark reports to compare how your performance stacks up against industry standards.
Dreamdata B2B Benchmarks enables you to compare against benchmarks instantly in-app.
The feature consists of four reports: Ad Budget, Web Traffic, Ad Performance and Journey Metrics, each offering insights into how other B2Bs are driving their growth; helping you succeed with yours.
Benchmarks collects data from all accounts that have not opted out of being part of benchmarks (more about the data at the end of the article).
In this post, we’re taking a closer look at each report:
The four benchmark reports:
Ad budget
Ad performance
Web traffic
Journey metrics
Getting started with Dreamdata Benchmarks
A word about the data
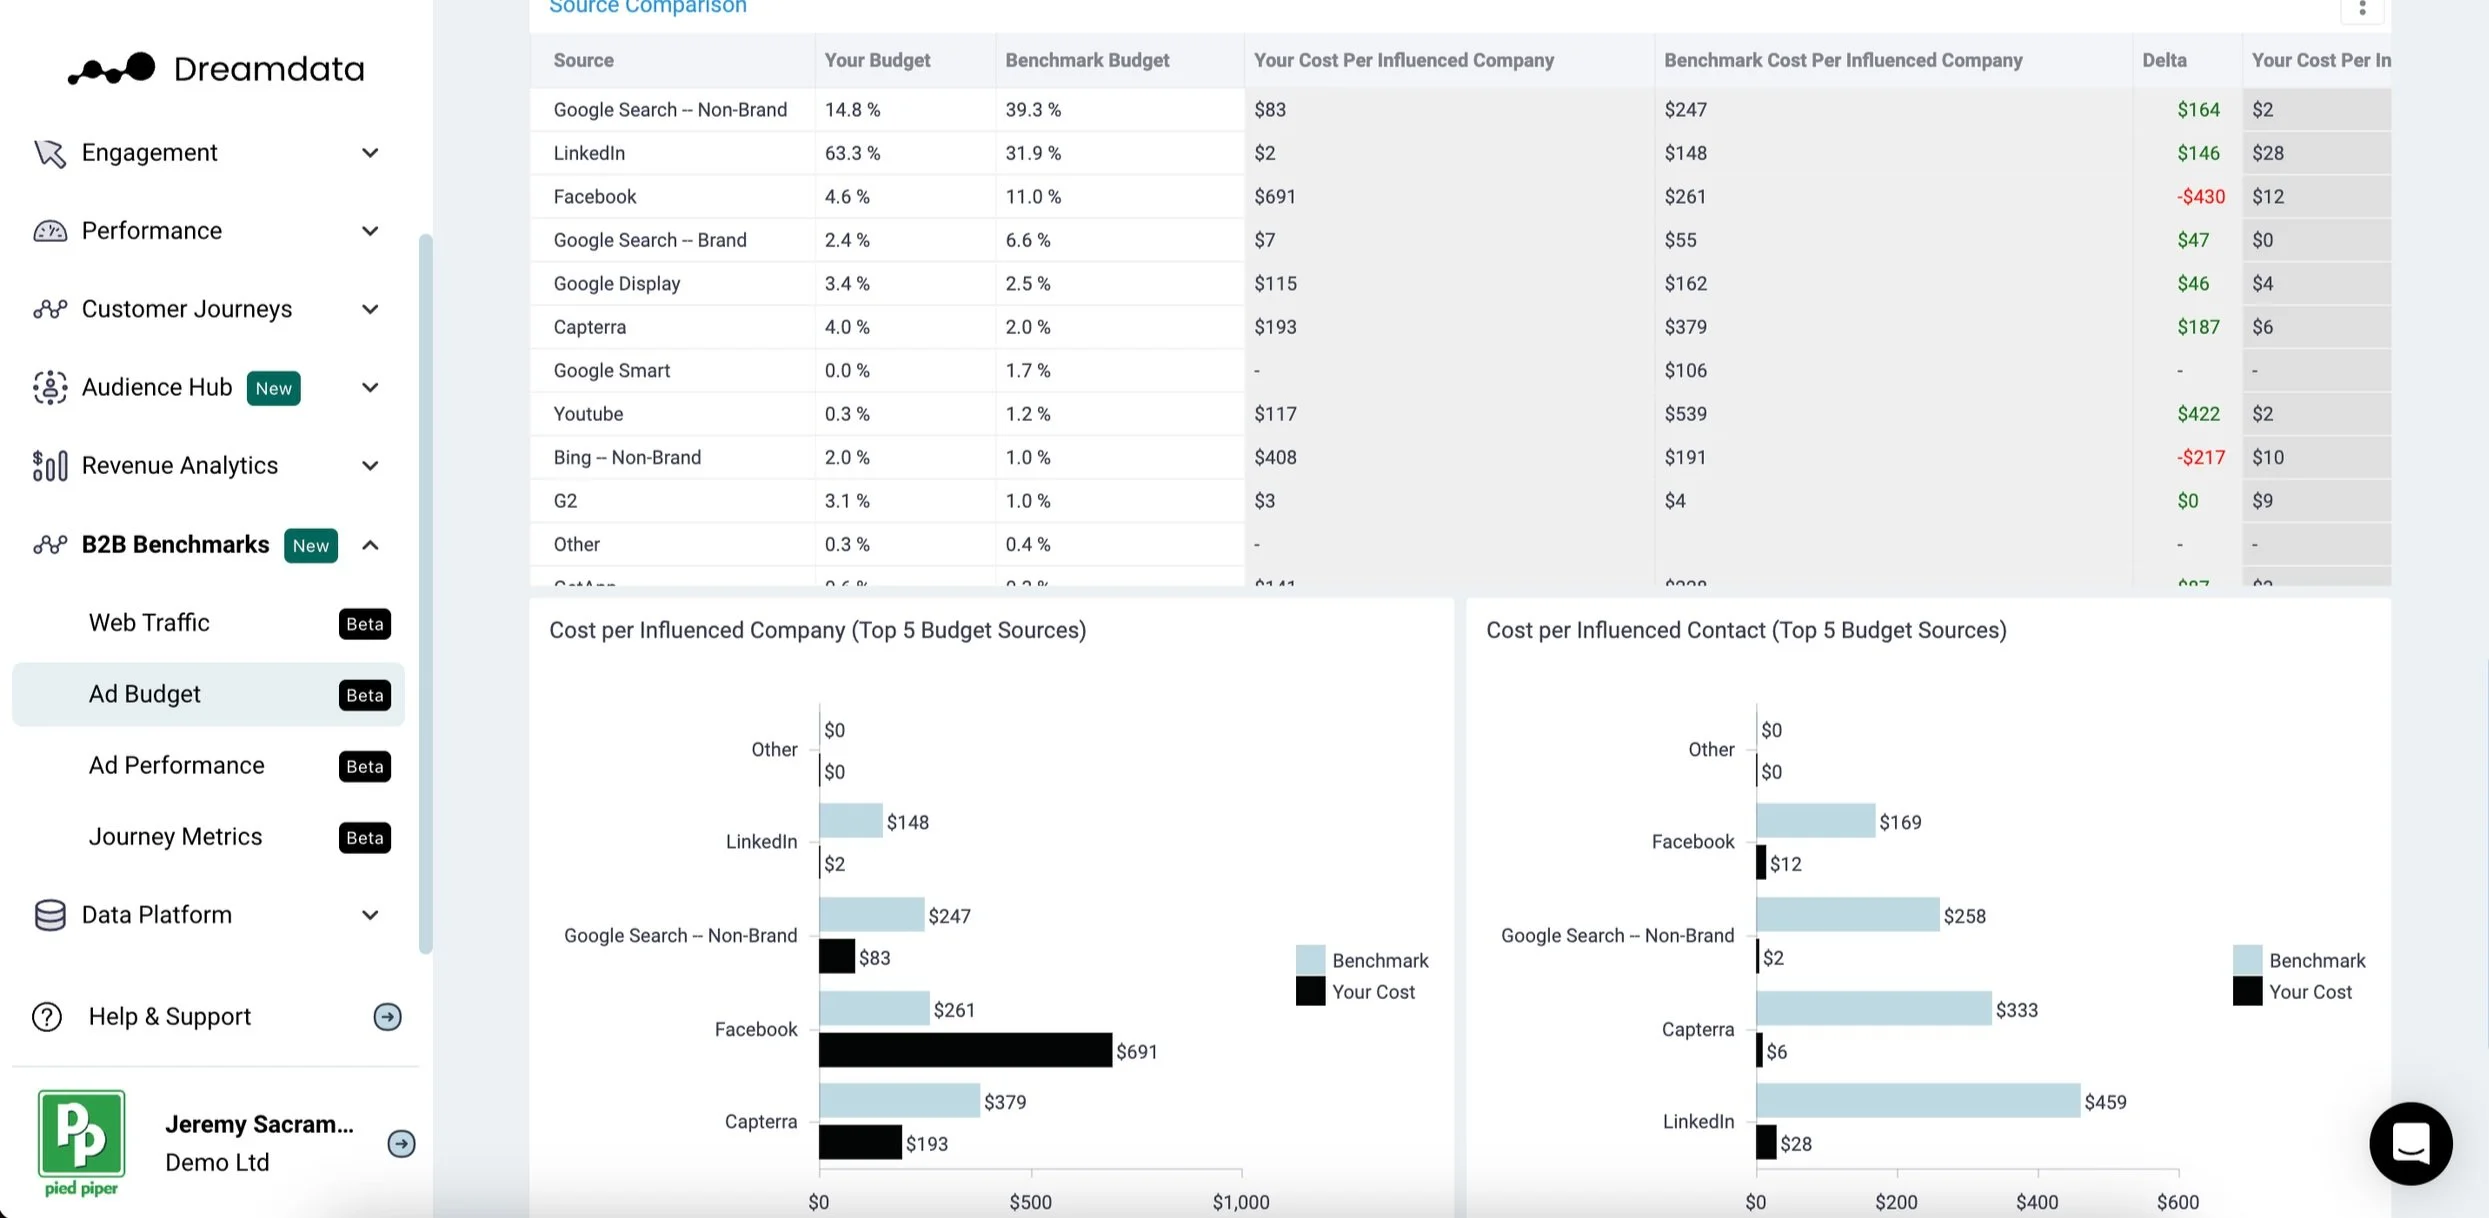
The Ad Budget report

The Ad Budget report presents an overview of where B2Bs are investing their paid budget. This helps you compare your own investments against industry standards to see how much of the B2B ad budget goes towards LinkedIn, Google Search, or Facebook.
All Benchmark reports can be filtered by all B2Bs, industries, or company size, helping you focus your comparisons on what you care about the most.
Are other B2Bs in your industry spending more on LinkedIn? Are you overspending on Google? How do you compare with the average ad spend on YouTube?
With Benchmarks you can also narrow down to compare against companies in your specific industry or companies of your size.
This will help you better plan your next budget, helping you set realistic targets and goals. As well as help you monitor changes in trends. Are B2Bs cutting their spend on Facebook Ads? Are they betting more heavily on Google Display Ads?
Branded vs non-branded Google Search Ads
The reports make use of Dreamdata’s brand/non-brand filter, to offer insights into spend on branded and non-branded terms on Google Search. This helps better analyse how B2B companies are splitting their budget on each of these types of campaigns.
We recently ran a study on these stats and contrast them against ROAS. Check out the study here →
Cost per influenced Company
You’ll also find the cost per influenced company and cost per influenced contact metrics in the Ad Budget report. These are vital metrics in a B2B context in assessing the acquisition cost of each source, and how you compare against each.
The breakdown between the two helps you better understand the acquisition of individuals and the more relevant B2B metric of company acquisition.
To amplify where you can have the most immediate impact on your ad budget allocation, we’ve added two additional tables zooming in on the top 5 sources you spend the most budget on.
The Ad Performance report
The Ad Performance report presents a range of B2B paid performance benchmarks across the ad networks, including CPC, CPM, CTR, cost per contact and cost per company.

With the Ad Performance report, you just need to select the ad network and metric you wish to evaluate and you can instantly see how you compare. What is the average CPM on Google Display for a company your size? How does the average LinkedIn CPC compare against Google Search Ads?
This helps you easily check whether your CPM or CPC sit above or below industry averages.
The report also includes budget spend on the ad network over the period so you can contrast between periods of greater investment and those where the budget has been more constrained, offering insights into budget allocation for optimal effectiveness and seasonal trends.
Benchmark Distribution showing how you rank against other B2Bs
The report includes benchmark quartiles that enable you to better understand how the best and worst performers in their industry compare - with the bolded font helping you see which quartile you currently fall in. This in turn can help you set achievable goals and targets to improve your own activities.
What does a ‘good’ CTR look like on LinkedIn, what does a ‘poor’ CPM look like on YouTube?
Similarly, you can use this data to assess whether your budget could be more efficiently spent on different ad networks. Say you’re in the top percentile of B2Bs in your industry in terms of LinkedIn Ads CTR, but fall in the last quartile on Google Ads CTR. You can easily jump into your Google Ads performance reports on Dreamdata, check the worst-performing campaigns, scrap them, and put that budget into LinkedIn.

The Journey Metrics report
The Journey Metrics benchmarks report presents B2B go-to-market metrics like journey length and the number of sessions involved at different stages of the customer journey.

This enables you to track your journey length over time to assess if your funnels are faster or slower than the industry standards.
How many sessions were there between MQL and Opportunity created over how long a period for companies in your industry? How does that compare with the period between Opp created and Opp closed?
The current benchmark data shows us that the average time in sales pipeline (SQL to Closed Won) is 95 days.
The Web Traffic report

The Web Traffic report reveals how other companies generate and sustain web traffic, offering valuable insights you can use to optimize your own strategy.
Are you driving as many email visitors to your site? Are your SEO activities bearing fruit? How do they compare to your paid traffic? Are you getting less traffic from sources other B2Bs grow from?
The report answers the fundamental question of where your traffic originates from and how that compares to industry standards. Helping you see where you can improve performance in exciting channels or adopt new channels which other companies in your industry are succeeding with.
Get started with Dreamdata Benchmarks
Dreamdata Benchmarks enable you to compare your B2B performance with industry benchmarks instantly - a first of its kind in the B2B space.
The four reports are a strategic tool that enables B2B companies to assess their performance, set goals, drive improvement, and stay competitive in their respective industries.
The best thing is that you can access these reports as soon as you sign up to Dreamdata and set your stage funnels - and the Ad Performance and Ad Budget reports are available on our Free plan!
Users are automatically opted-in to Benchmarks but you are able to opt out should you not wish your data to be shared - more on the data below.
See what else is included in Dreamdata Free →
A word about the data
The data used to compile these benchmarks is anonymised aggregated data* taken from all Dreamdata customers (who have not opted out of the Benchmarks**).
To make the Benchmarks as accurate and reliable as possible, our methodology includes the following:
Normalizing the data to allow a fair comparison among accounts with different advertising spend.
Only including accounts with a minimum spend to avoid non-representative data.
Using median and quartiles to remove the influence of outliers that might skew the metrics.
Aligning definitions for the funnel stages through a setting that everyone can set up inside our product.
You can read more about how Dreamdata pulls and enriches data on industries, size, etc. And about tracking more generally here.
* At Dreamdata we take data security and privacy very seriously. Dreamdata has processed only non-PII data for this study. The data insights are aggregated, and a minimum number of data points (accounts) has been introduced for every benchmark meaning it is not possible to identify individual companies. Only data from companies that have agreed to let us use data in benchmarks are included.
** Would you like your anonymous data not to be included in the Dreamdata Benchmark Report? You can choose to opt out. Opting out means your data won't be used, and you won't have access to the report.