
Announcing The 2026 LinkedIn Ads Benchmarks Report by Dreamdata
It’s official! Our yearly LinkedIn Ads B2B Benchmarks Report is live.
Last year, we published our 2025 Linkedin Ads Benchmarks report showing LinkedIn Ads delivered 113% return on ad spend (ROAS) across Dreamdata customers.
This year’s data tells an even clearer story: LinkedIn’s ROAS is now 121%, their share of budget continues to grow.
B2B customer journeys involve more people, more touchpoints, and happen over a much longer timeline - long before a deal ever becomes a sales opportunity.
Below are some of our personal highlights from Dreamdata’s 2026 LinkedIn Ads Benchmarks Report, built on our customers aggregated data across 66M+ sessions and 3.5M+ customer journeys.
Download the full LinkedIn Ads B2B Benchmarks Report!
Skip ahead to:
The 7-month marketing marathon
LinkedIn wins budget share
The LinkedIn ROAS advantage
LinkedIn’s Ad influence gets stronger as deals get closer to close
For the first time, we can see organic LinkedIn company page activity
How marketers unlock better LinkedIn Ads performance
Conclusion
The 7-month marketing marathon: B2B deals are won before sales gets involved
A familiar question comes up in B2B budget reviews: “We spent money on LinkedIn last month. How much revenue did it generate this month?”
It’s a reasonable question, but in B2B buying, it’s often the wrong one.
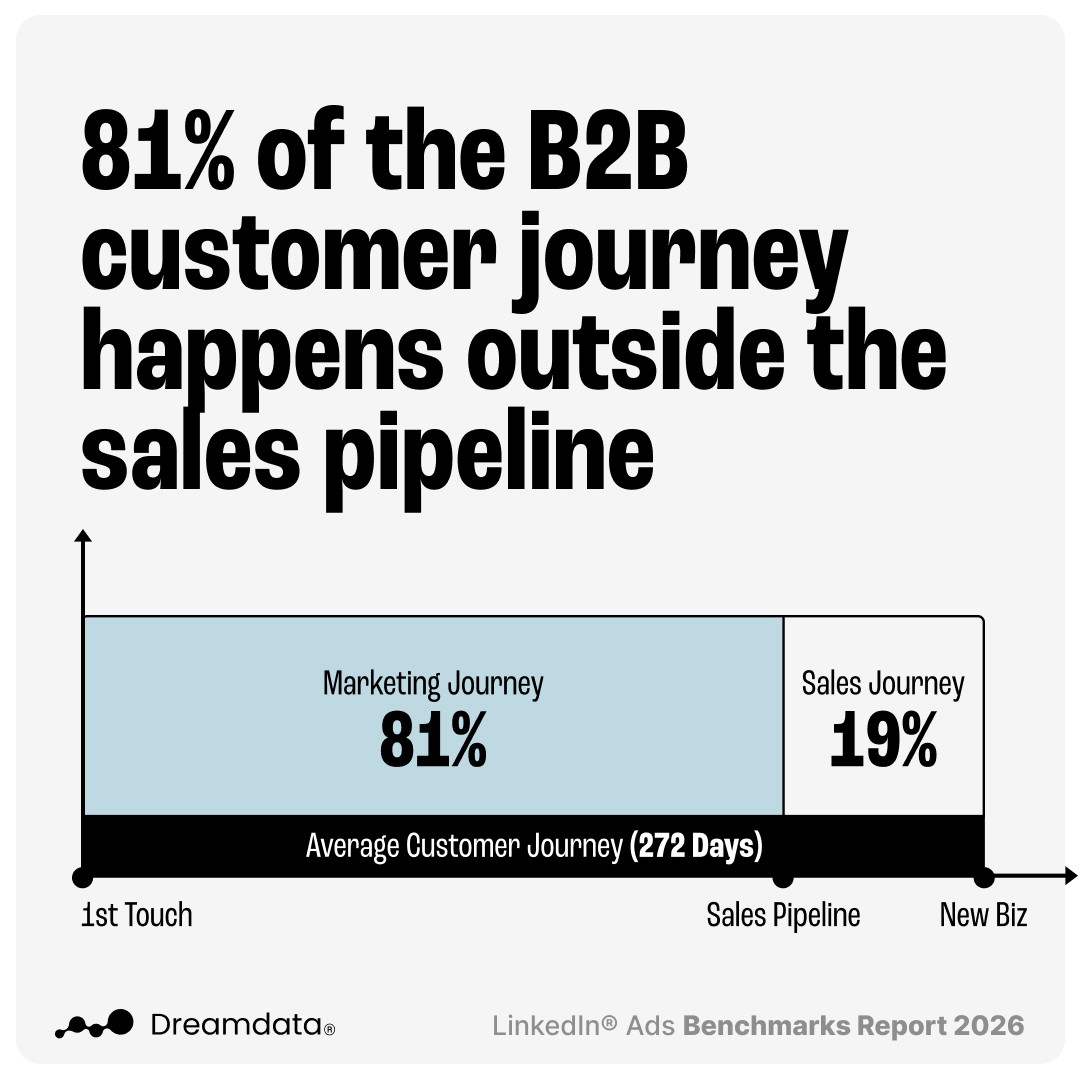
81% of the B2B customer journey now happens outside the sales pipeline - up from 70% last year. And within that journey, it’s getting more complex.
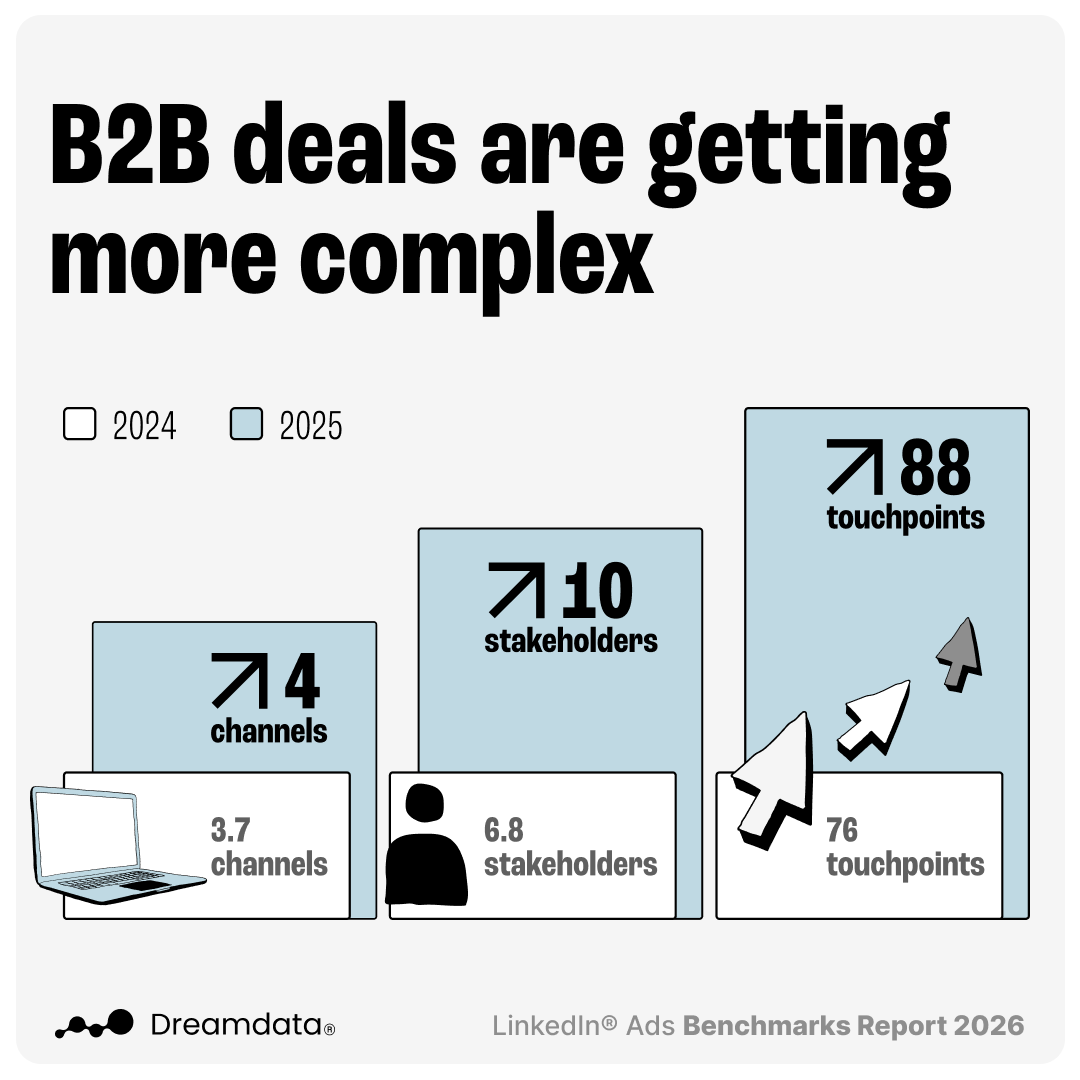
Buyers have an average of 88 touchpoints (up from 76)
Across 4 channels (up from 3.7)
With 10 stakeholders involved (up from 6.8)
So why are we expected to measure success after a month, when B2B deals clearly take months and involve many people, channels, and touchpoints?
We’ve established that the marketing journey is a long one. Where might marketers be placing their budget bets, and has there been any movement among the latest ad channels?
LinkedIn wins budget share
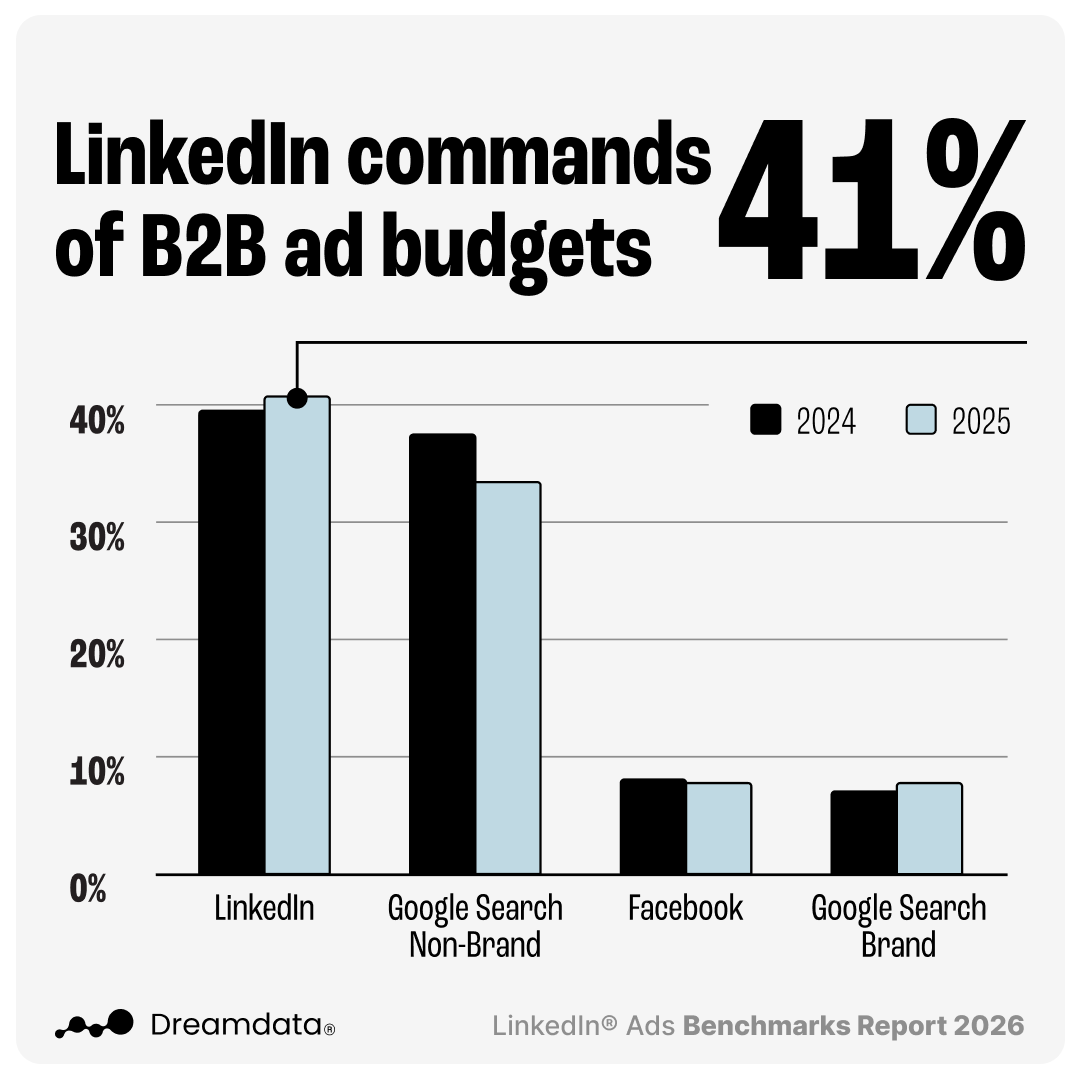
LinkedIn now commands 41% of total B2B ad budgets, up 2% since last year. It’s still the largest single advertising investment for B2B companies.
At the same time, something else is happening:
Non-branded search budgets have dropped from 37% in 2024 to 33% in 2025.
Cost per clicks (CPC) on those non-branded terms have jumped 29%
Click-through rates (CTR) have fallen by 26%
Our point of view on the drop in non-branded Google search budget? As AI Overviews answer queries up front, CTRs on non-branded search ads have decreased.
If you were getting charged more money for less engagement on your ads, would you continue spending hard-fought budget on that channel?
Perhaps this points to marketers reallocating spend toward channels that influence buyers earlier and more consistently.
The LinkedIn ROAS advantage: The only platform still delivering a positive return
At a surface level, LinkedIn CPC is higher (€5.98). That looks expensive compared to Meta's €1.60 CPC. But in B2B, we close companies, not contacts. When we shift from contact-level metrics to company-level performance, the story flips:
Cost per company influenced on LinkedIn: €70.11 (down from €154 last year)
Meta: €128.70
Google Search: €110.37
Then comes the revenue impact:
LinkedIn ROAS has grown to 121% in 2025 (up from 113% in 2024)
Google Search: 67%
Meta: 51%

And for top-performing Dreamdata customers (≤75th percentile), LinkedIn’s ROAS more than doubles to 279%, while Meta hits 133% and Google Search reaches 138%.
This is the core lesson for Demand Gen and Marketing Ops teams: if your dashboards are still optimized around cheap clicks and cost per lead, you may be underinvesting in what drives revenue.
LinkedIn’s Ad influence gets stronger as deals get closer to close
Something of note is that LinkedIn Ad influence actually strengthens as deals move closer to close. This is a marked difference from last year's story where LinkedIn Ad influence declined as companies progressed towards New Business.
LinkedIn Ads account for 24.2% of all sessions at the MQL stage, rising to 30.2% at SQL, and 28.3% at the New Business stage. Unlike last year's findings, LinkedIn’s influence doesn’t decline as prospects move down funnel, but strengthens when Sales is engaged.
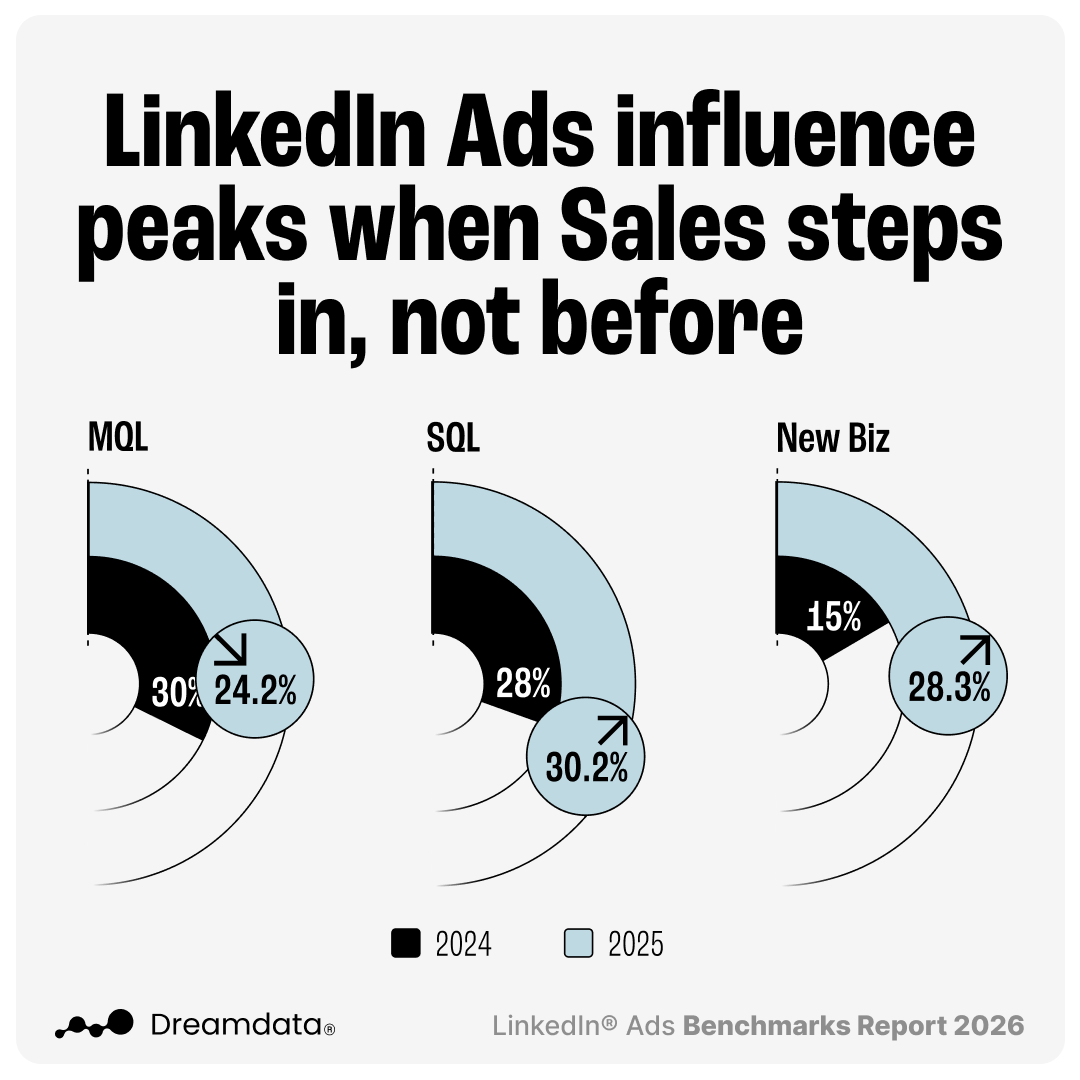
So what might this change signify? When buying committees of 10+ people spend 81% of their journey researching independently, you can’t afford to disappear once a lead is captured. You need to stay present across the entire buying journey.
Could this be telling us that LinkedIn is increasingly being used not just to generate demand - but to engage buying groups throughout the entire evaluation process?
To understand how far back that influence actually starts, we looked at the average time from different types of LinkedIn Ads signals to closed revenue:
First ad impression to revenue: 281 days
First ad conversion to revenue: 214 days
First ad engagement to revenue: 212 days
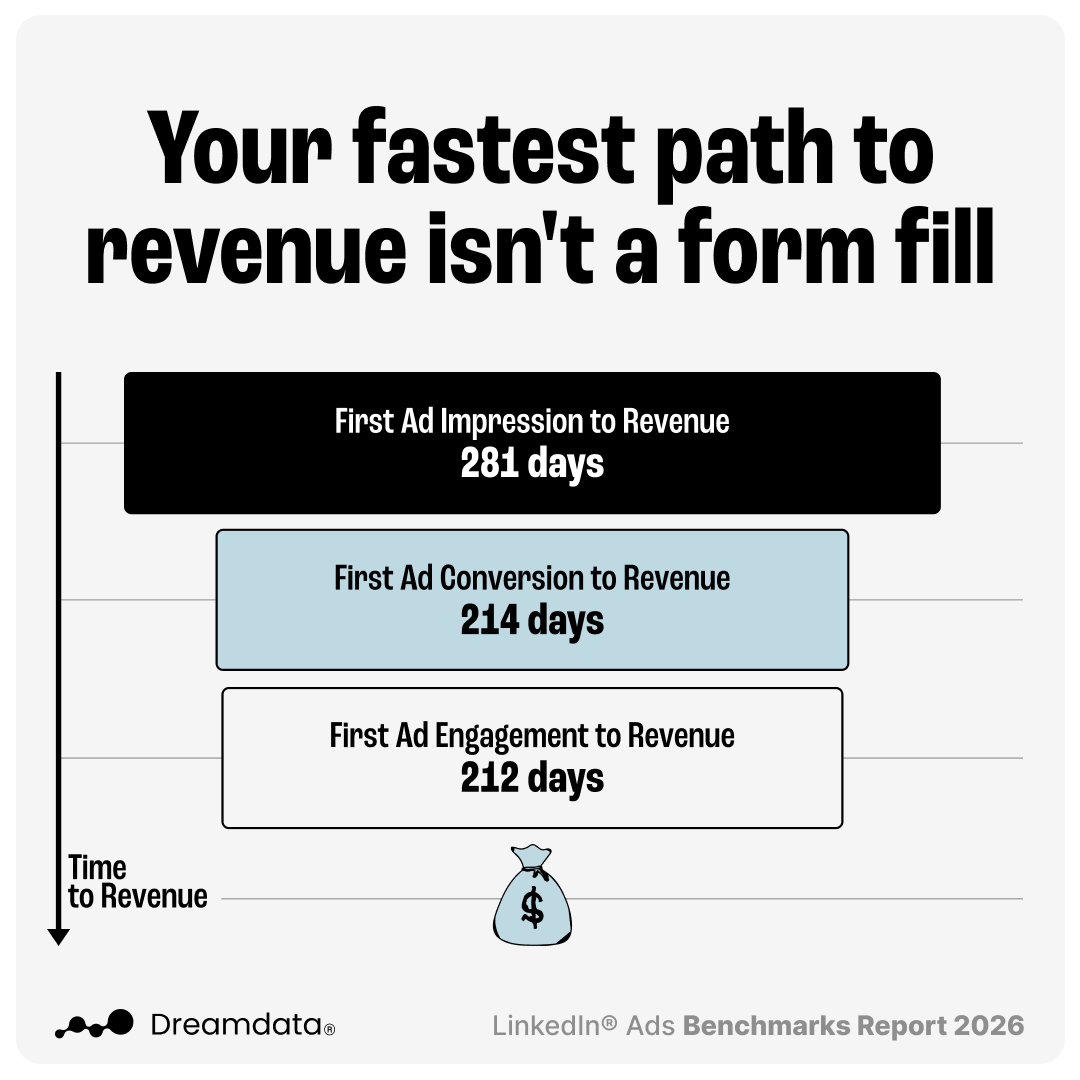
The impression figure makes sense. Impressions sit furthest up the funnel, often the very first moment a prospect encounters your brand. But here's what's interesting: the gap between conversion and engagement is only two days.
That near-identical timeline challenges a common assumption in marketing - that a form fill is a stronger intent signal than a video view, a comment, or a click that didn't convert.
One explanation could be that LinkedIn conversions in B2B are often early-stage actions. A content download or webinar sign-up can happen long before a company is anywhere near an active buying cycle, driven by curiosity rather than purchase intent.
Meanwhile, someone who engages with an ad may be doing so because the message resonated at a moment of genuine relevance.
In other words, a conversion isn't always a stronger signal than an engagement, it’s just a different one.
For the first time, we can see organic LinkedIn company page activity
Now comes the newest addition to our report. For the first time ever, organic LinkedIn company page activity can be connected to revenue influence directly in Dreamdata.
This addition comes with the introduction of LinkedIn’s Company Intelligence API, which means that Dreamdata pulls more company-level insights (including paid and organic impressions).
With this new data, we’ve looked at the influence of organic company page impressions. What the data shows is that company page impression influence increases down funnel. Company Page impressions appear in:
9.4% of MQLs
15% at SQL
17.9% of closed deals

What this is telling us is that nearly 1 in 5 closed deals involved someone from the buying committee visiting your LinkedIn Company Page. And for those deals, the average time from that first organic impression to closed revenue is just 90 days.
A company page visit isn't early-stage curiosity in the way a first ad impression typically is. It could be a signal that someone is already doing their homework on you specifically, checking your story, your content, your credibility. By that point, a deal is likely already forming somewhere in the background.
That means if a target account views your Company Page, you should treat it as a high-intent signal and act on it: trigger targeted LinkedIn ads to that account, add them to retargeting or high-intent audience segments, and notify Sales.
So, think full-funnel when you’re posting on LinkedIn, not just top-of-funnel. You need sustained presence across the entire cycle.
How marketers unlock better LinkedIn Ads performance
In B2B buying, we’ve established that touchpoints take place across platforms. Conversions happen both ‘online’ (within an ad platform’s tracking scope) and ‘offline’ (on another platform, typically the CRM).
B2B Marketers need to be sending this valuable offline data back into their advertising platforms to automate the optimization of the ads.
With LinkedIn’s Conversions API (CAPI) you can feed LinkedIn Ads with ‘offline’ conversion data - pipeline and revenue data stored traditionally in the CRM.
This enables marketers to get even more out of your ads with better matching, ad relevance optimisation, and aggregate reporting on ad conversions - without compromising privacy compliance.
By integrating CAPI in Dreamdata, B2B marketers can send pipeline and revenue data back to LinkedIn Ads.
This helps LinkedIn Ads gain clarity of what types of users and accounts become pipeline and revenue months after the initial ad click or engagement - so it can go on to automatically optimize your next campaigns.
And the benefits? A 20% reduction in CPA and 31% increase in attributed revenue. What’s not to like?
Conclusion
Customer journeys are longer and more complex, buying committees are larger, and when marketers measure performance at the company level - not just the contact level - LinkedIn continues to lead on efficiency and revenue impact.
We’ve seen a 41% share of B2B ad budgets, a 121% ROAS on LinkedIn overall, and strengthening Ad and company page influence deeper in the funnel.
But this blog only scratches the surface. What else can you find in this report?
A detailed breakdown of budget allocation across all major ad channels
Full CPC, CTR, CPM, cost-per-contact, and cost-per-company benchmarks
Deep analysis of customer journey length across different company sizes
The time from LinkedIn signal (impression, engagement, conversion) to revenue
And so much more!
If you want to understand what “good” looks like for LinkedIn Ads performance in 2026 (and how your results compare) download the full 2026 LinkedIn Ads Benchmarks report.