
Get the most out of your Capterra ads with B2B attribution

Capterra is huge in the B2B SaaS segment, and especially amongst small companies. According to this enlyft research, 73% of Capterra’s vendors have <50 employees.
This isn’t really surprising. Review sites help unknown brands showcase their product amongst competitors and offer prospective customers extremely valuable user reviews.
But it doesn’t end there, review sites like Capterra offer a host of other direct and indirect advantages to businesses. For instance, they help nail down your category and in so doing fine-tune your positioning (more on this a little later).
Unfortunately, competition for ‘organic’ ranking is tough. More often than not your awesome product is lacking enough reviews to rank near the top organically. The answer: Capterra ads.
Through Capterra paid ads, you can help supercharge your lead generation and all the tangential benefits I just mentioned.
But, like any PPC channel, pumping money into ads willy nilly doesn’t guarantee higher demand, and less so, good leads. Especially if all you’re measuring are clicks.
In this post, we’re going to tackle this issue head-on and offer a solution for getting the most out of your Capterra ads.
Contents:
Capterra: a key channel in the B2B marketer’s toolkit
B2B Attribution on your Capterra ads
Getting the most out of Capterra ads
Capterra: a key channel in the B2B marketer’s toolkit
Like a good old PPC, Capterra allows you to buy ads on any of their categories. Which essentially means buying a higher rank in category search results. So that when a buyer explores a category you’re up there to market your product.
Other benefits to having an ad on Capterra include getting a direct link from the ad to your website, jumping a loop (of landing on your Capterra profile).

Capterra also offers the added bonus of being part of the Gartner Digital Markets family, which include services like Software Advice and GetApp. This means that if you choose Capterra, your product doesn't just get exposure on Capterra, but on all these three services.
Unlike Google and other search ads, however, review sites theoretically sit slightly lower in the funnel, with those users searching on Capterra showing some intent to buy by virtue of being looking at (and comparing) specific products.
The attraction of accessing this treasure trove of millions of users showing buying intent is obvious and doesn’t need repeating.
But now we return to the crux of this post. How can you avoid Capterra becoming a money pit, that generates little demand and poor leads?
Attribution. Attribution. Attribution.
Capterra ads B2B attribution
A B2B attribution platform connects all your go-to-market activities (including Capterra) to revenue and pipeline generated. Meaning you know exactly what’s working and what isn’t.
This is where Capterra’s integration with Dreamdata comes into play.
By integrating Capterra with Dreamdata, all your Capterra data gets pulled through our modelling, enabling tailored attribution and actionable analytics to be run on it.
Let’s have a look at how it works.
Two moving parts:
The revenue link starts from the moment you connect Capterra through our integration. Dreamdata then starts pulling the data automatically via the Capterra API and storing it on BigQuery.
Simultaneously, our platform works to identify the Capterra ad click event with the specific contact (and account) in your CRM. For this to happen you need to:
Have our (or leading CDP’s) tracking script on your website to track all anonymous_id/user_id and urls. More on our tracking script here.
Make sure UTMs on your Capterra ads are functioning with the url showing all relevant parameters.
Then your Capterra data is automatically preprocessed and mapped for attribution with other sources of data from across your ecosystem (traffic, events, crm, ads platform, etc.). Giving you that crucial link to revenue.
Dreamdata’s Capterra ads dashboard
This data processing is taking place behind the scenes. As a B2B marketer you’ll be working with the Capterra ads dashboard on the Dreamdata platform - here’s where you can work your magic.
But before revealing some useful spells (use cases) for the dashboard, let’s give you a glimpse of what it looks like.

You first get an overview of all the headline metrics. Besides the Cost and Clicks which are readily available on Capterra’s in-house dashboard, you get a breakdown of the traffic you’re pulling from Capterra. This includes the number of visitors who are contacts in your pipeline and the number of companies (accounts) these represent.
Values will, of course, change depending on the attribution model, revenue model and time span selected (more on the filters below).
In this overview, you’ll also see the ‘average position’ metric which gives you a snapshot of where you’re ranking on average across all categories.
Beneath this headline overview you then find a couple of reports which offer details on each of the categories you’re running ads on.
The first is this Category Performance report:

Apart from the cost side of things, you’ll find a breakdown of deals and revenue per category, as well as the respective ROAS.
With Dreamdata’s Journey dashboards you can then identify when in each of the accounts buyer journey Capterra has been a touch. I’ll get into more detail on this in the use cases below.
The second report shows performance by country with the same metrics.

Finally, all the data can be manipulated using the filters on the top right of the dashboard. In the Capterra dashboard, you’re able to filter the reporting by a wide range of criteria, including: country, url, ‘revenue model’ and ‘attribution model’.
You can read more about revenue attribution models here.

Want to see the dashboard in use? Why not check out our Capterra Ads video here.
Getting your Capterra ads to work
Those are some mean looking dashboards - we know 🤗 - but how exactly do they help you make the most out of your Capterra efforts?
Here are five example use cases:
1. Spending 💷 on the right Capterra categories
“Dreamdata’s Capterra dashboard shows us the ROAS of our ads by category, giving us vital insights into which categories are working for us and which aren’t.”
Time Green, Head of Marketing and Partnerships, TeamUp
Chances are you’re casting your ads net across a number of categories. If you’re not, you should. There might be leads swimming in other (related) categories that you’re not capturing - especially if your positioning is a little askew (more on this in a bit).
By seeing the ROAS of each of your categories you can at-a-glance assess which is proving the better investment.
From this you can then decide whether you want to drop the category altogether, or increase bid to rank higher.
Cross referencing your average position on the category against the number of visitors and ROAS can help you guage whether there is potential to capture more (quality) leads.
NOTE: before you can really make this assessment you need to give them time. The average buyer journey in B2B is between 6 and 12 months. So any experiments need to be given enough time to make the assessment. See this article on the importance of the Time-to-Revenue metric.
2. Know the quality of your traffic
In a similar fashion to the above, the Category Performance report can also help you assess the quality of your traffic.
A category might be generating comparatively good Visitor numbers, but the number of deals or pipeline generated may be poor.
Let’s look at the example report.
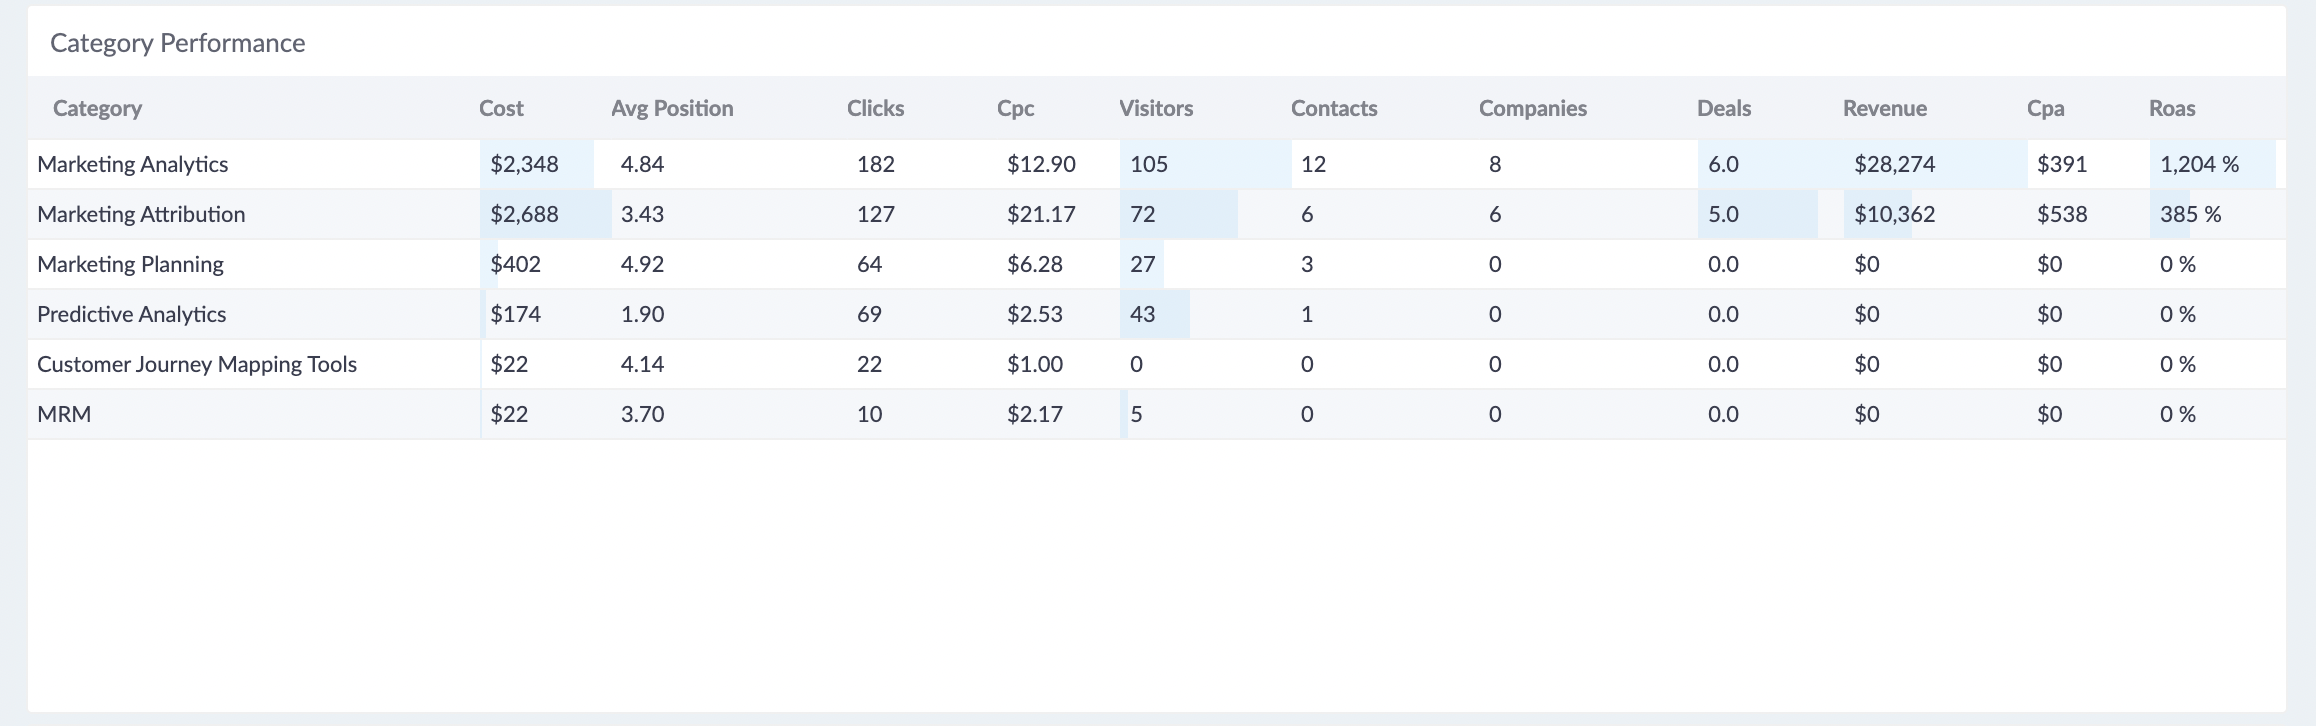
You see that ‘Marketing Attribution’ might be generating poor quality traffic. You’ve got about 75% of the traffic that ‘Marketing Analytics’ is generating, but the ROAS is about 25%. Meaning that the traffic is of poorer quality in this category.
Again here, you can gauge whether to out-bid the competition and rank higher or scrap the category altogether.
3. Finetune your positioning - improve your messaging
After enough time (that time-to-revenue metric again) you can test your assumptions on categories you assume you sit in. In other words, looking across all metrics you can verify whether the categories you guessed your leads would be swimming are in fact where your leads are swimming!
In our example case, ‘Predictive Analytics’ is a candidate for removal. There is something about the product which just doesn’t resonate with prospective buyers navigating Capterra.
Which means, if your positioning has hinged on zeroing in on Predictive Analytics, this is an indicator that you might be missing the mark.
You may recognise this approach for Google Ads Keywords. Actually, you’ll probably be interested in this post on our updated Google Ads dashboards.
Of course, this exercise shouldn’t substitute conversations with actual customers about your messaging (and positioning). Does your narrative fit with the outcomes they’re getting from your product?
For more on Positioning, I highly recommend April Dunford’s ‘Obviously Awesome’.
4. See where on the customer journey Capterra is making an impact
Outside the Capterra dashboard, Dreamdata offers a Customer Journey map on every user and account that’s had a touch with you.
After filtering accounts or contacts by Sources/Capterra, you access a list of all the ones that have had a Capterra touch. Clicking through will take you to this view 👇
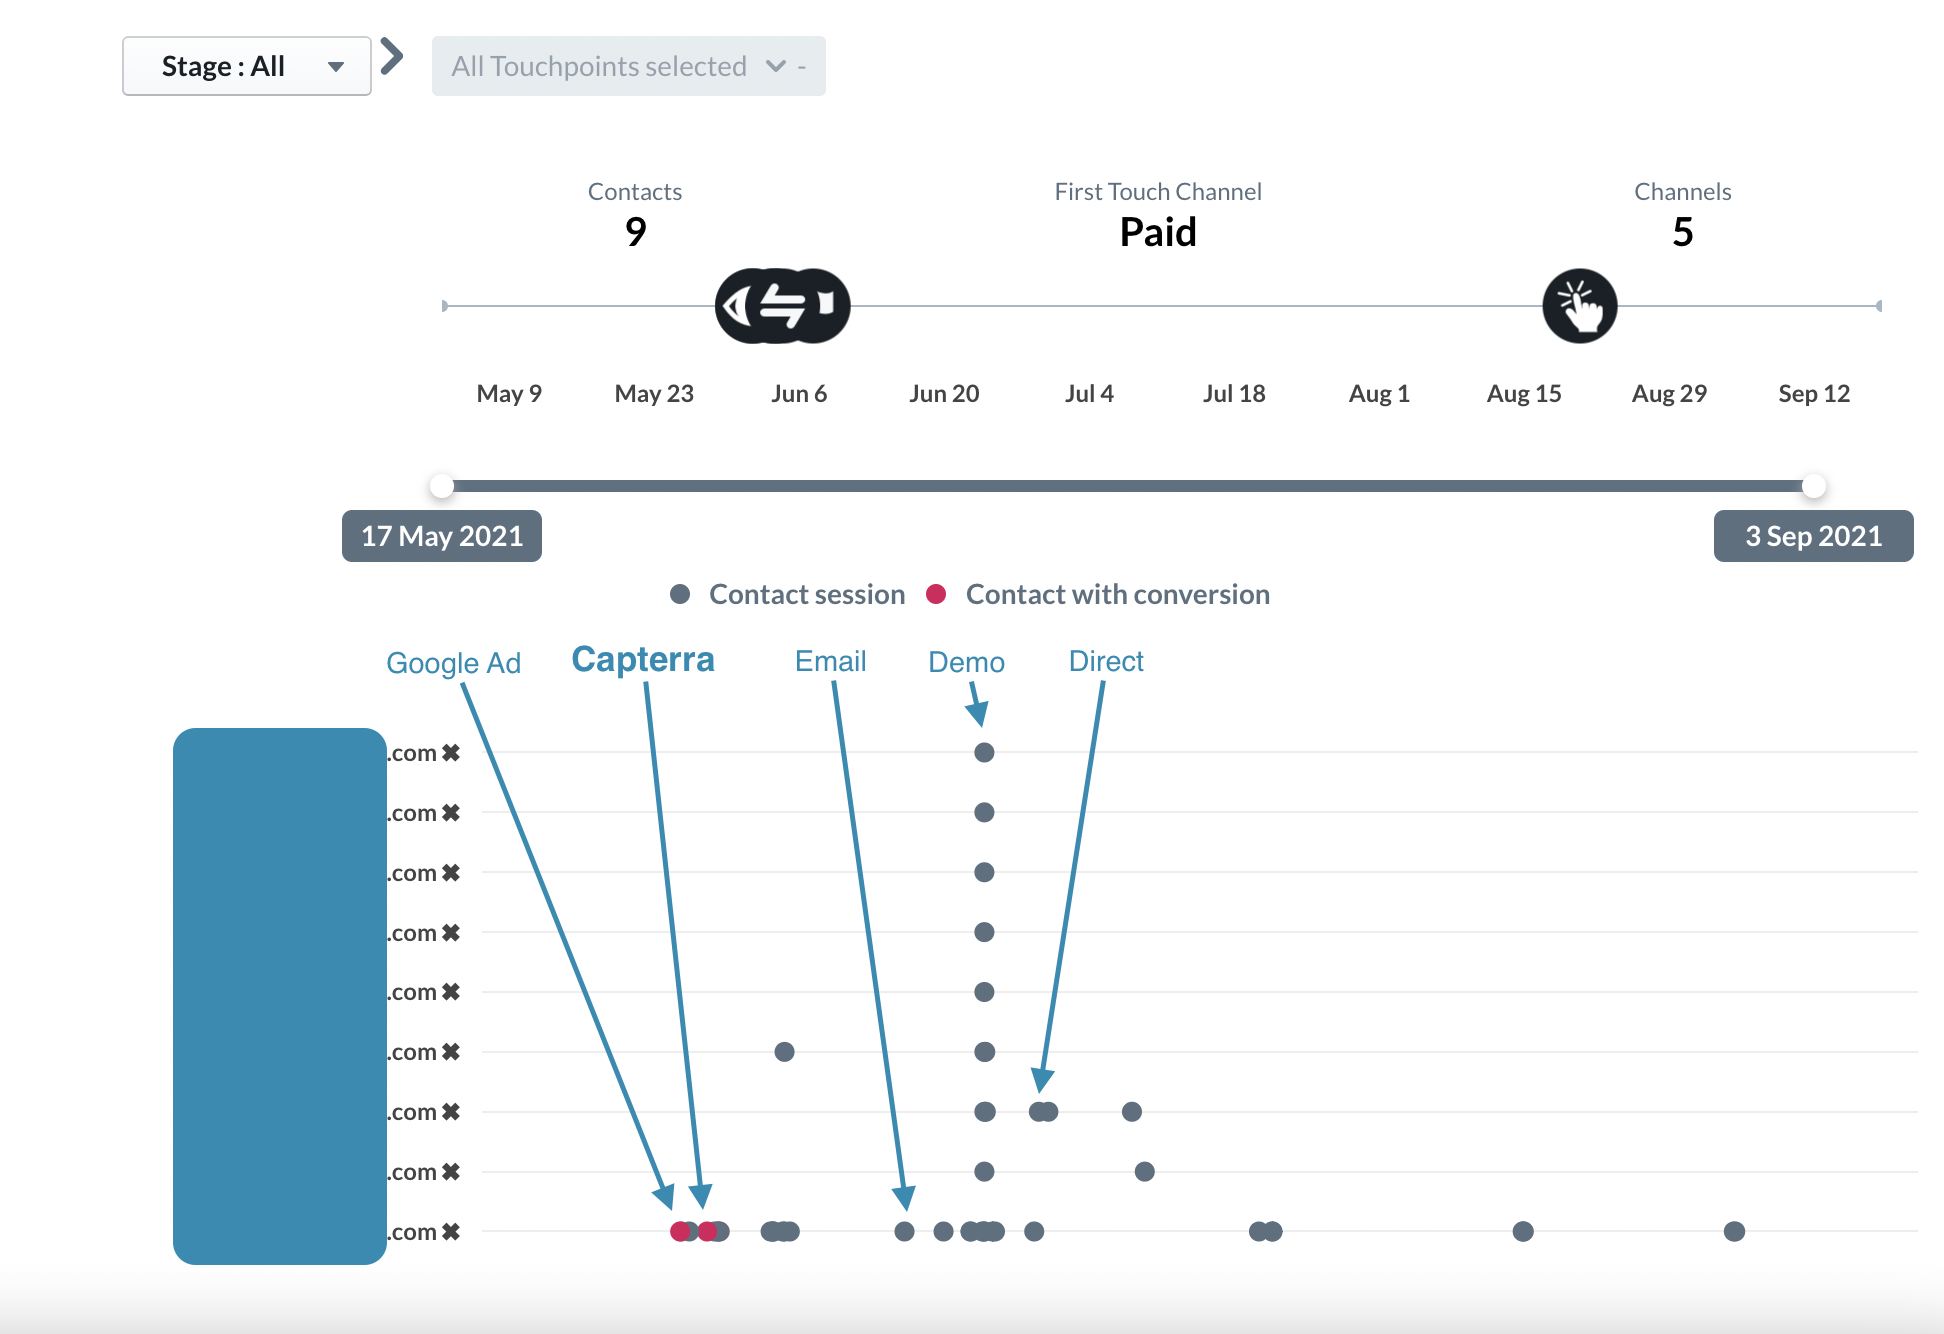
Here it’s easy to identify where and when Capterra has played a part in the particular lead’s buying journey.
5. Assess whether Capterra ads are even worth the investment
With Dreamdata you can then compare how Capterra performs against your wider paid efforts.

You can dig deeper into multi-channel attribution for B2Bs in this post.
In this Paid channels dashboard on Dreamdata’s platform you can easily compare the performance of each of your paid channels against each other.
Find out more about what the Capterra ads integration with Dreamdata offers here.
Conclusion (TL;DR): Capterra goes further with Dreamdata
As competition for leads on Capterra continues to intensify, so too does the need to know how your paid efforts on the site are performing.
At the most basic level you need to be asking the querstion: are your category campaigns actually generating pipeline and revenue? Is Capterra - as a paid channel - even worth it?
Simple questions right?
Not really. Any accurate answer requires you to connect your Capterra ads to revenue.
In this article, we’ve shown how attribution, B2B Revenue Attribution, achieves this.
By integrating Capterra with Dreamdata, you’ll gain access to dashboards and reports ( showcased above 👆) which make sure you’re:
Spending 💷 on the right Capterra categories
Know the quality of your traffic
Finetune your positioning - improve your messaging
See where on the customer journey Capterra is making an impact
Assess whether Capterra ads are even worth the investment
So by way of conclusion, the surest way to build and scale success with Capterra is through attribution modelling.
Check out what the process is for integrating Capterra to Dreamdata.
Start using Dreamdata free today.