
#dreamdatarecipes
How to measure your Days to Value with Dreamdata

The Days to Value metric measures how long it takes your average customers to move from one stage of the pipeline to the next (e,g first-touch to MQL, MQL to SQL) and ultimately revenue.
Your Days to Value metric should be the antecedent of every Go-to-market analysis you run.
This is because without knowing your Days to Value metric it’s next to impossible to benchmark the performance of your efforts.
For instance, say it takes 54 days for a prospect to go from first-touch to form submit. If you’re assessing the impact of your campaign after just one month, you’re going to arrive at erroneous conclusions about the campaign’s performance.
In this recipe, we’re showing you how you can use your Days to Value metric with Dreamdata – you’ll want to read Step 3. 👀
Step 1: Finding your Days to Value metric in Dreamdata
You can find your Days to Value metric under the Revenue Analytics → Reporting dashboard.
Here you’ll first need to set your date parameters. We recommend setting at least half a year but preferably a full year, in order to ensure an accurate reading.
You’ll then have to set your stage, i.e. what part of the pipeline you wish to examine. We recommend starting with ‘New Biz’ (which is the full days to revenue) and then moving downwards to SQL and MQL. Although this will of course depend on the nature of your analysis.
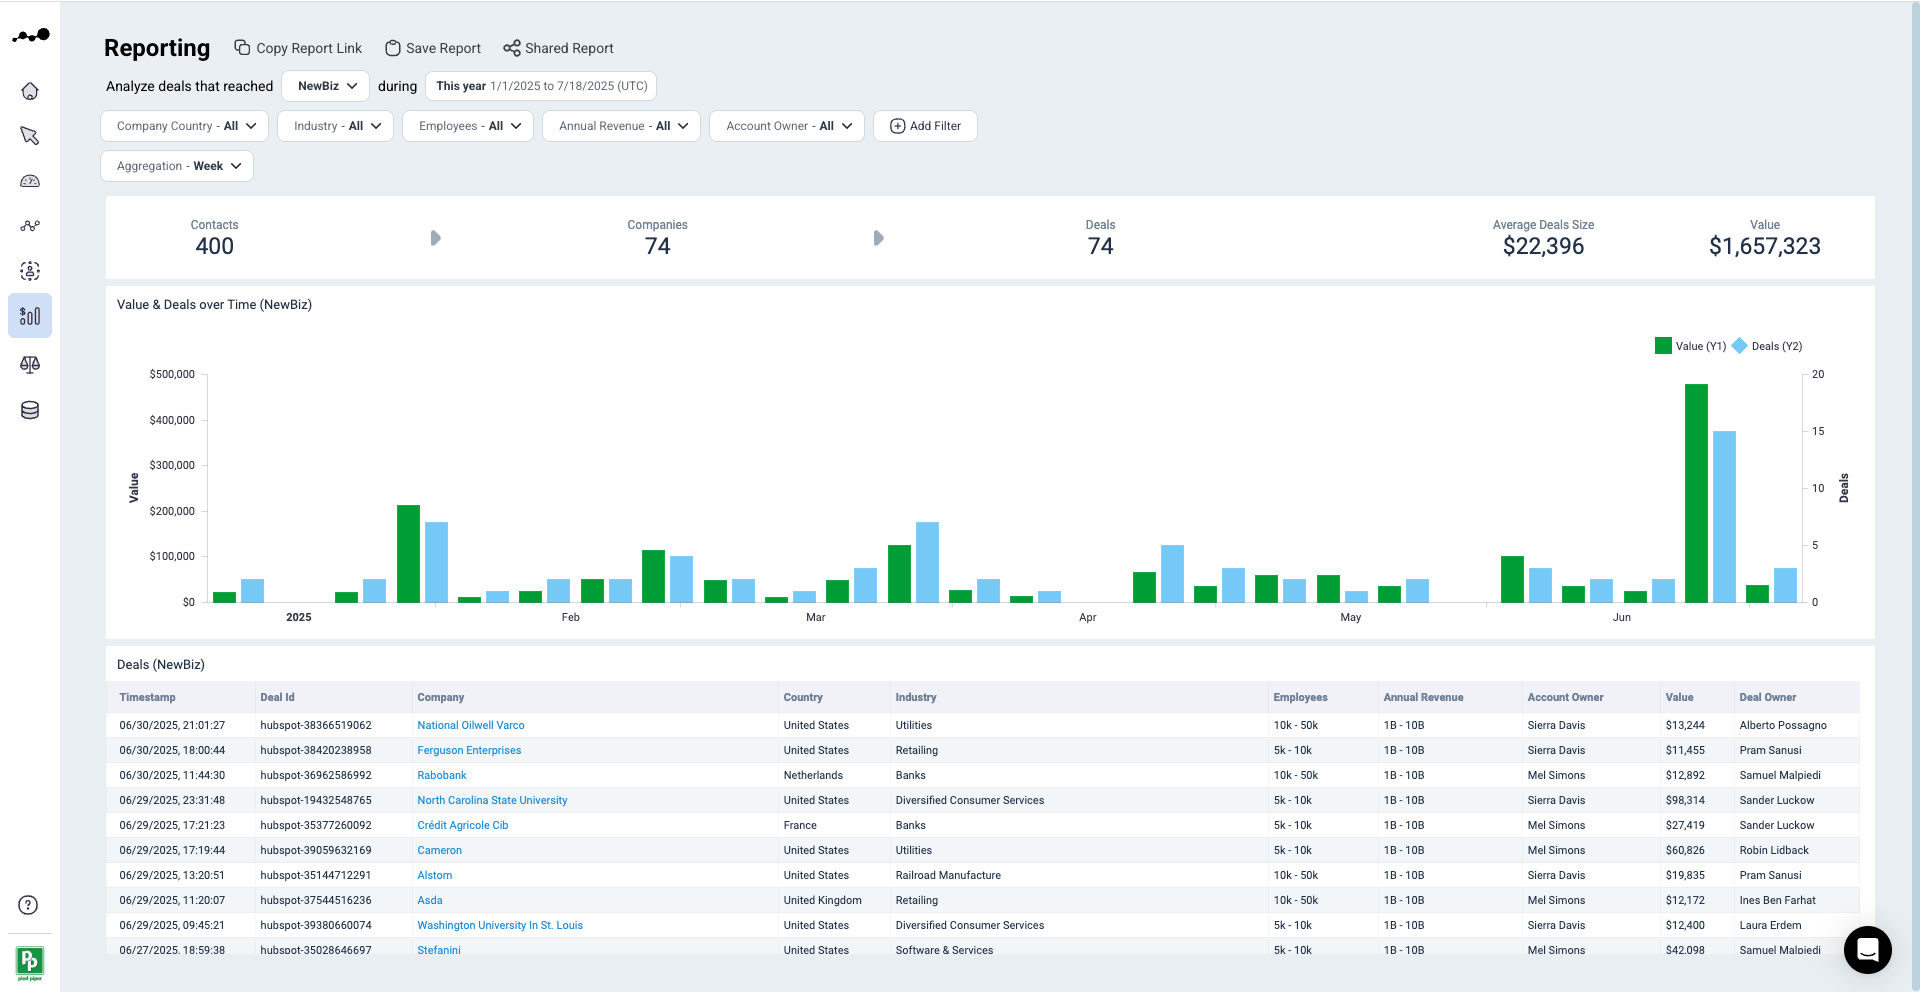
It’s worth highlighting that displayed days to value will always account for first touch to your chosen stage. E.g. If your chosen stage is MQL, then your days to value metric will show how long it takes for your prospects to go from first-touch to MQL.
Step 2: Segmenting your Days to Value data
Head over to the Segmentation dashboard which allows for a more detailed Days to Value analysis into specific segments.
In this dashboard you’ll find the Days to Value metric in the second row expressed as the average number of days of all the deals generated in the selected stage.
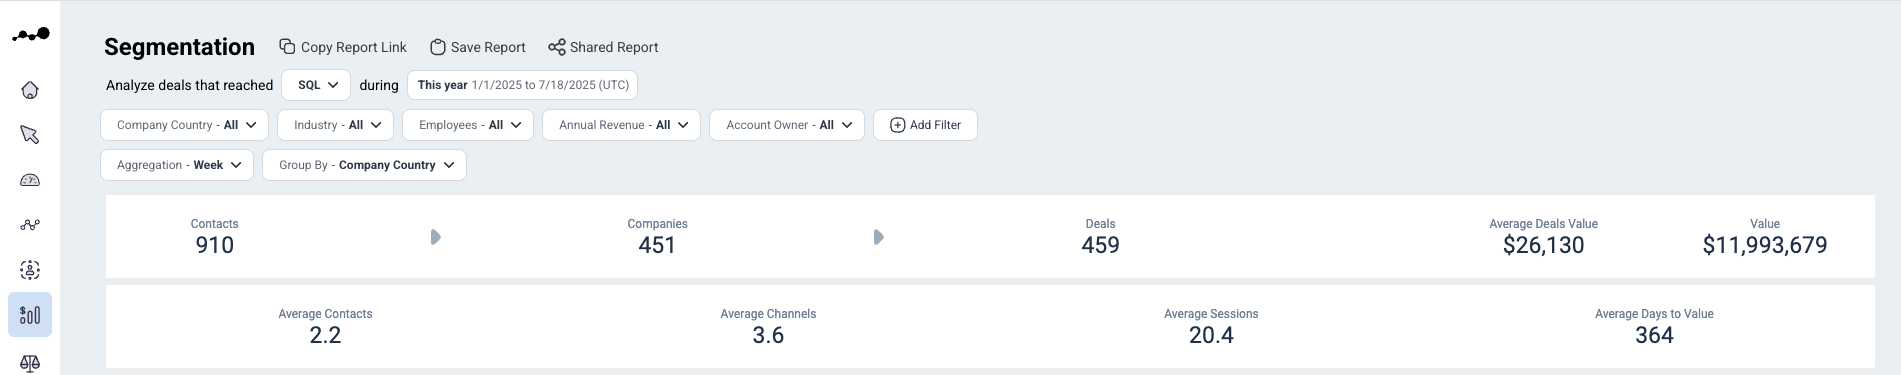
Making sure that your date range and stage are set, move onto to the second row of filters and select your desired segmentation criteria.
Then simply scroll down to the table and compare the average Days to Value.
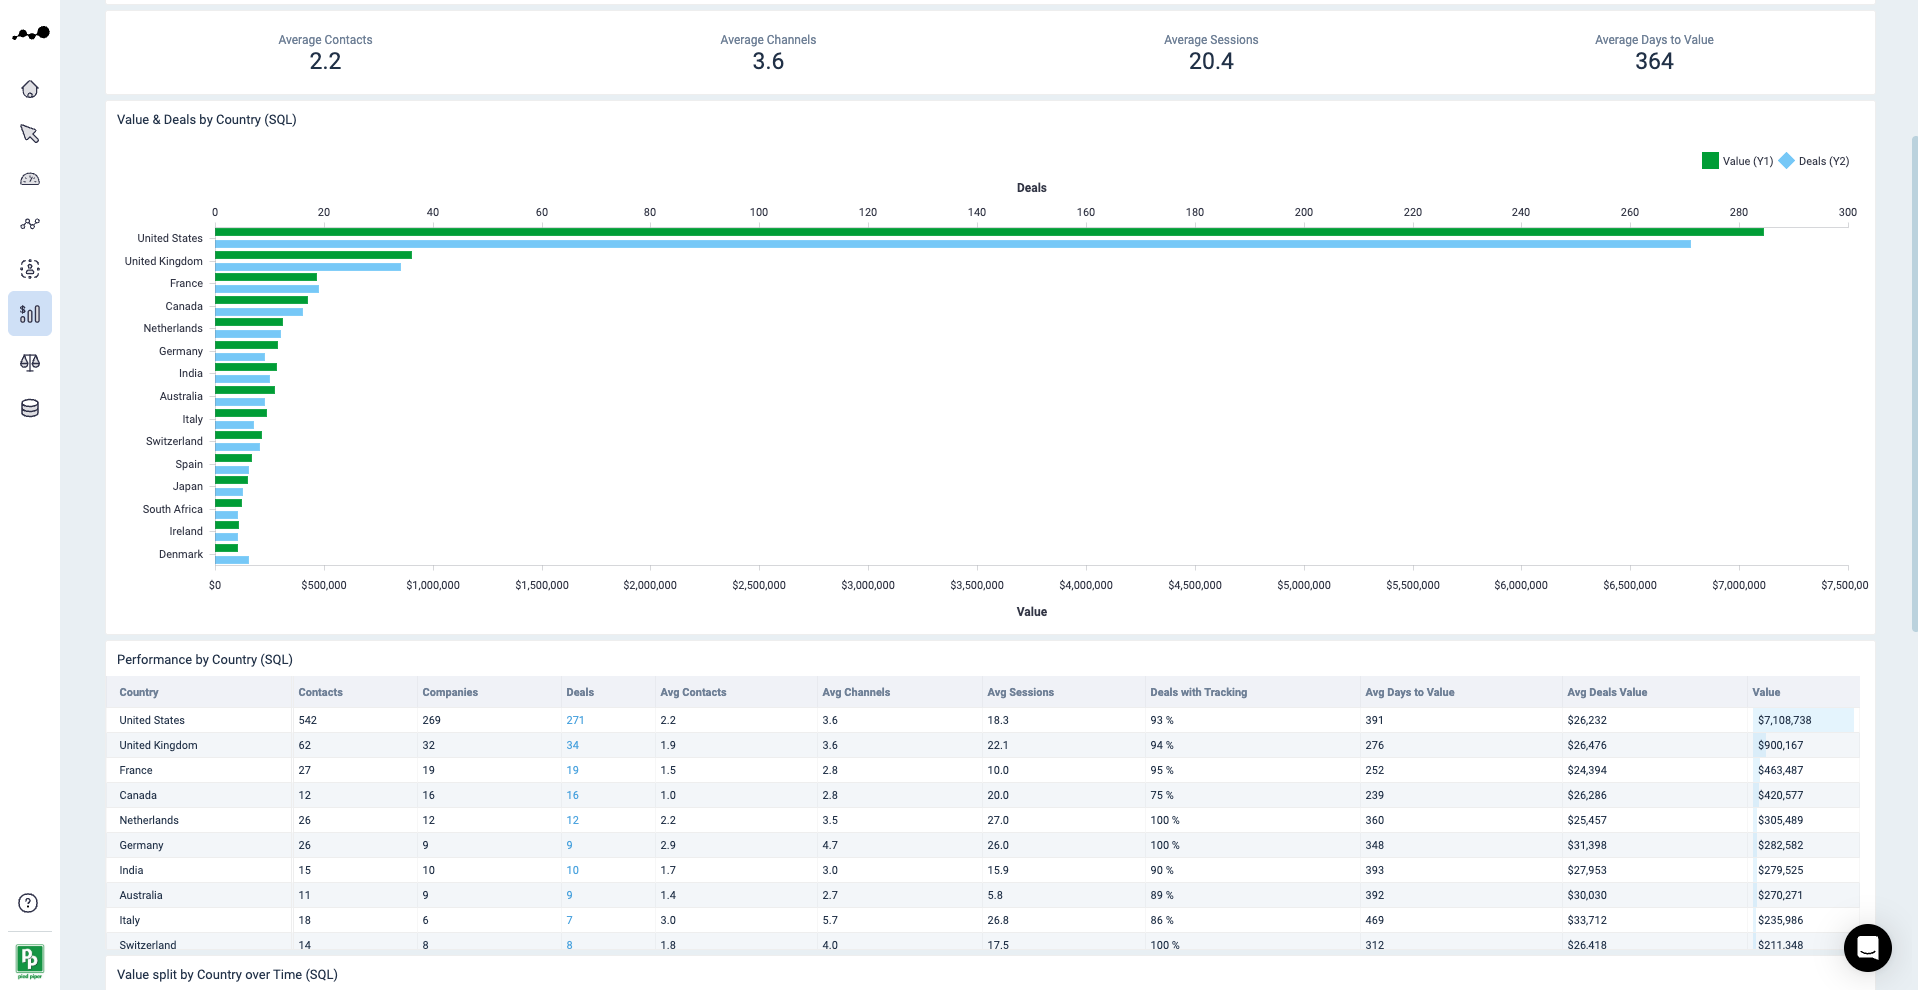
From this you can set expectations on how long certain customers will take and plan accordingly. It can also serve as a benchmark to see whether you can drive down this number over time.
You might be interested in this article on increasing pipeline velocity.
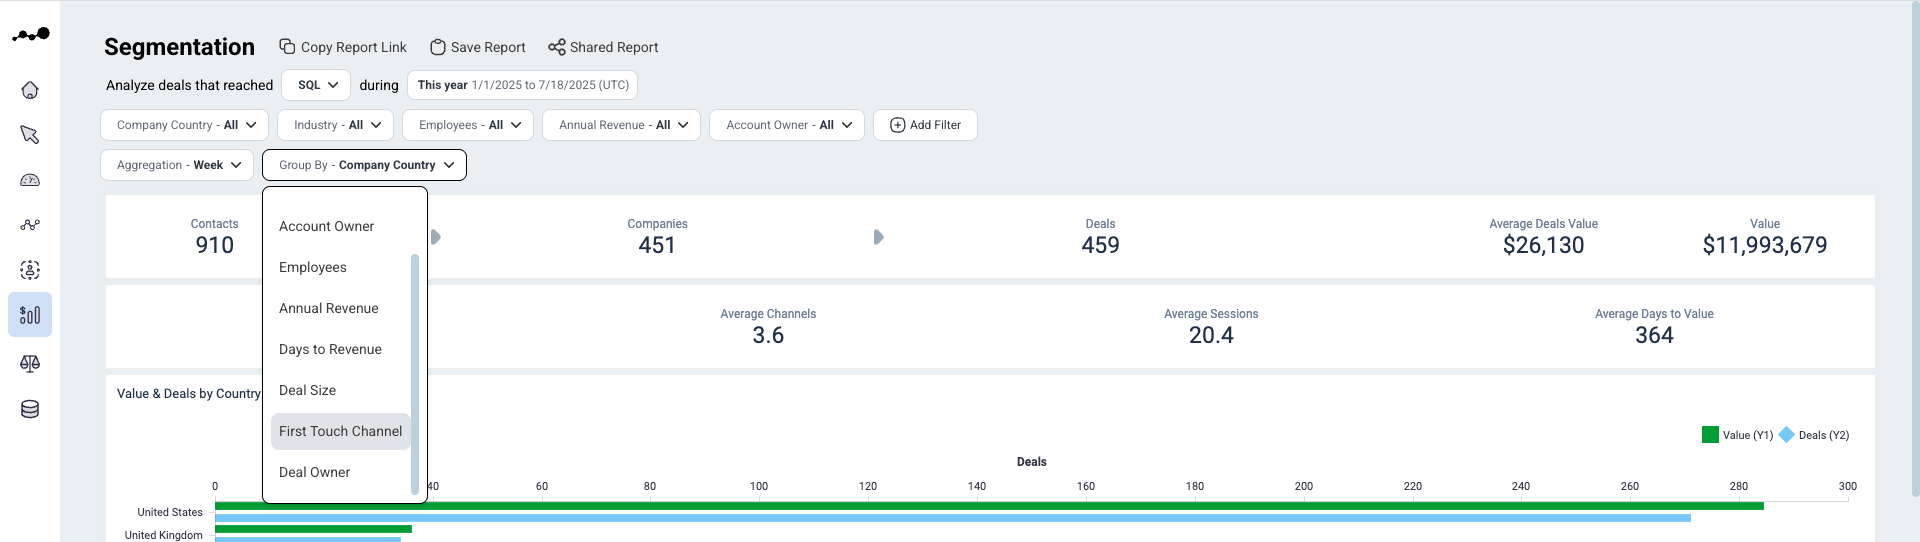
Step 3: [Bonus] Using Days to Value for first-touch channel analysis
You can gain even deeper insights by running a first-touch channel analysis.
This pipeline analysis helps us to better understand how long it takes for prospects to move from a specific first touch to your chosen stage.
To get this data you need to click on the “Group By” filter and select “First Touch Channel”.
Then scroll down to find the table which shows your performance by first touch channel.
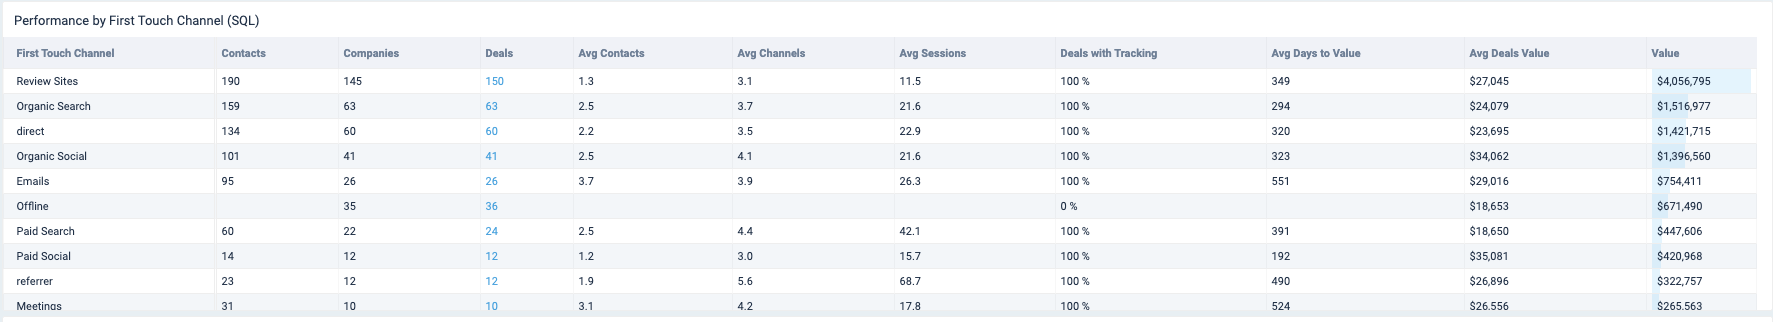
This table provides information about the prospects that started their customer journey through a specific channel.
From our example above you can see that 60 leads started their customer journey via paid search. The third column to the right shows that these 60 leads took 391 days to move from first touch to SQL. Meaning, if we would like to assess the performance of Google Search Ads, we should wait 391 days to do so. Otherwise, we would risk drawing wrong conclusions.
This clearly demonstrates how the Days to Value metric is crucial when evaluating different channels' performance.
Moreover, there are a number of benefits provided by Days to Value metric shown in this table. Here are some of the things you could use this metric for:
Compare cross-channels performance,
Learn when it’s the right time and for how long you should run analyses of your marketing activities,
Predict and forecast time to future sales accordingly,
Adjust budgets and optimise performance to scale your activities.
How it works:
Dreamdata offers end-to-end customer journey tracking, enabling the platform to see who is coming onto your site and from where. Channel, campaign, content – if it’s being tracked, it’s measured. And by connecting to your CRM, the measurement benchmark is actual pipeline and revenue generated.