
6 simple steps for increasing pipeline velocity
Pipeline velocity is one of the most powerful metrics out there. Not only does it help accurately benchmark how well your pipeline is performing, but the formula itself holds the secret to increasing velocity!
In this post, we’re covering the fundamentals of pipeline velocity and showing you the 6 steps you need to take to accelerate your pipeline.
Pipeline velocity is a metric used to calculate the speed of your pipeline. Tracked over regular time intervals, it offers an excellent benchmark for revenue and growth.
But pipeline velocity is more than just a measure of pipeline (and revenue) generation. Tracking pipeline velocity can itself be used as a mechanism for accelerating your pipeline and building growth.
By breaking down the pipeline velocity formula into its constituent metrics, you can build a recipe for increasing your pipeline velocity.
In this post, we’re going to show you how you can increase your pipeline velocity in six steps:
Step 1 - Make sure you’re (accurately) tracking all the metrics
Step 2 - Grow the number of leads in your pipeline
Step 3 - Increase your Sales win rate
Step 4 - Shrink your Sales cycle
Step 5 - Increase the average deal size
Step 6 - Develop a pipeline velocity strategy
Pipeline velocity: the fundamentals

Before moving on to the 6 steps for increasing pipeline velocity, we need to cover the fundamentals:
How to calculate pipeline velocity
The pipeline velocity formula is as follows:
No. of sales-qualified leads in your pipeline x win rate % x avg. deal size
--------------------------------------------------------
your current sales cycle in days
Let’s work through an example:
Say you have 30 Sales Qualified Leads in your pipeline, your present win rate is 10%, and your average deal size is $10,000
And let’s say your current sales cycle is 90 days.
The pipeline velocity calculation should look like this:
30 x 10 % x 10,000
----------------
90
Which gives you a pipeline velocity of $333 per day.
Yes, that’s right. Pipeline velocity is measured in dollars (or other currency) and not miles per hour…
Pipeline velocity is a relative metric
It’s obvious that this value on its own is pretty much useless. That’s because pipeline velocity is a relative measure, meaning you need to measure it against previous (and future) values.
The idea is to see the resulting value grow over time, i.e. increase velocity.
Increasing pipeline velocity: the four levers
The formula consists of four individual metrics:
The number of leads in your pipeline
Your average Sales win rate
Your average deal size
The time it takes your leads to purchase your product
Each of these is like four levers, which, when improved, help accelerate your pipeline and push up your pipeline velocity value.
In fact, this is what makes the pipeline velocity metric so useful. It encompasses the whole go-to-market motion and draws all focus on revenue.
Let’s jump into the 6 steps for increasing your pipeline velocity, shall we?
Step 1 - Make sure you’re (accurately) tracking end-to-end B2B go-to-market data
Your success in tackling the 4 steps that follow depends in large measure on accurate data tracking.
For instance, how will you know which leads to funnel into the pipeline if you don’t know what actions previously successful accounts’ took in the early days of their journey? Or how can you shorten your Sales cycle if you don’t know when it began
The B2B sales cycle however, doesn’t make itself easy to track.
B2B customer journey
For starters, the typical B2B customer journey is made up of accounts consisting of multiple individuals, using multiple devices, across multiple sessions, over multiple months.
On your end, the data is scattered across multiple platforms (and data silos), making it difficult to paint a holistic picture of what customers are doing.
And, without tracking and mapping the B2B customer journey as a single journey, and not one that’s broken into funnels and pipeline stages, it’s impossible to measure performance on the metrics that make up the pipeline velocity formula.
Solution for tracking the metrics that make up pipeline velocity
If you don’t yet have end-to-end go-to-market data tracking in place, you need a platform that collects, cleans, and transforms all your go-to-market data. This can either be built in-house or bought off-the-shelf.
This solution will help break down data silos and track the B2B customer journey as a unified process. From which you’ll be able to run performance reports on your paid, social, organic and sales efforts.
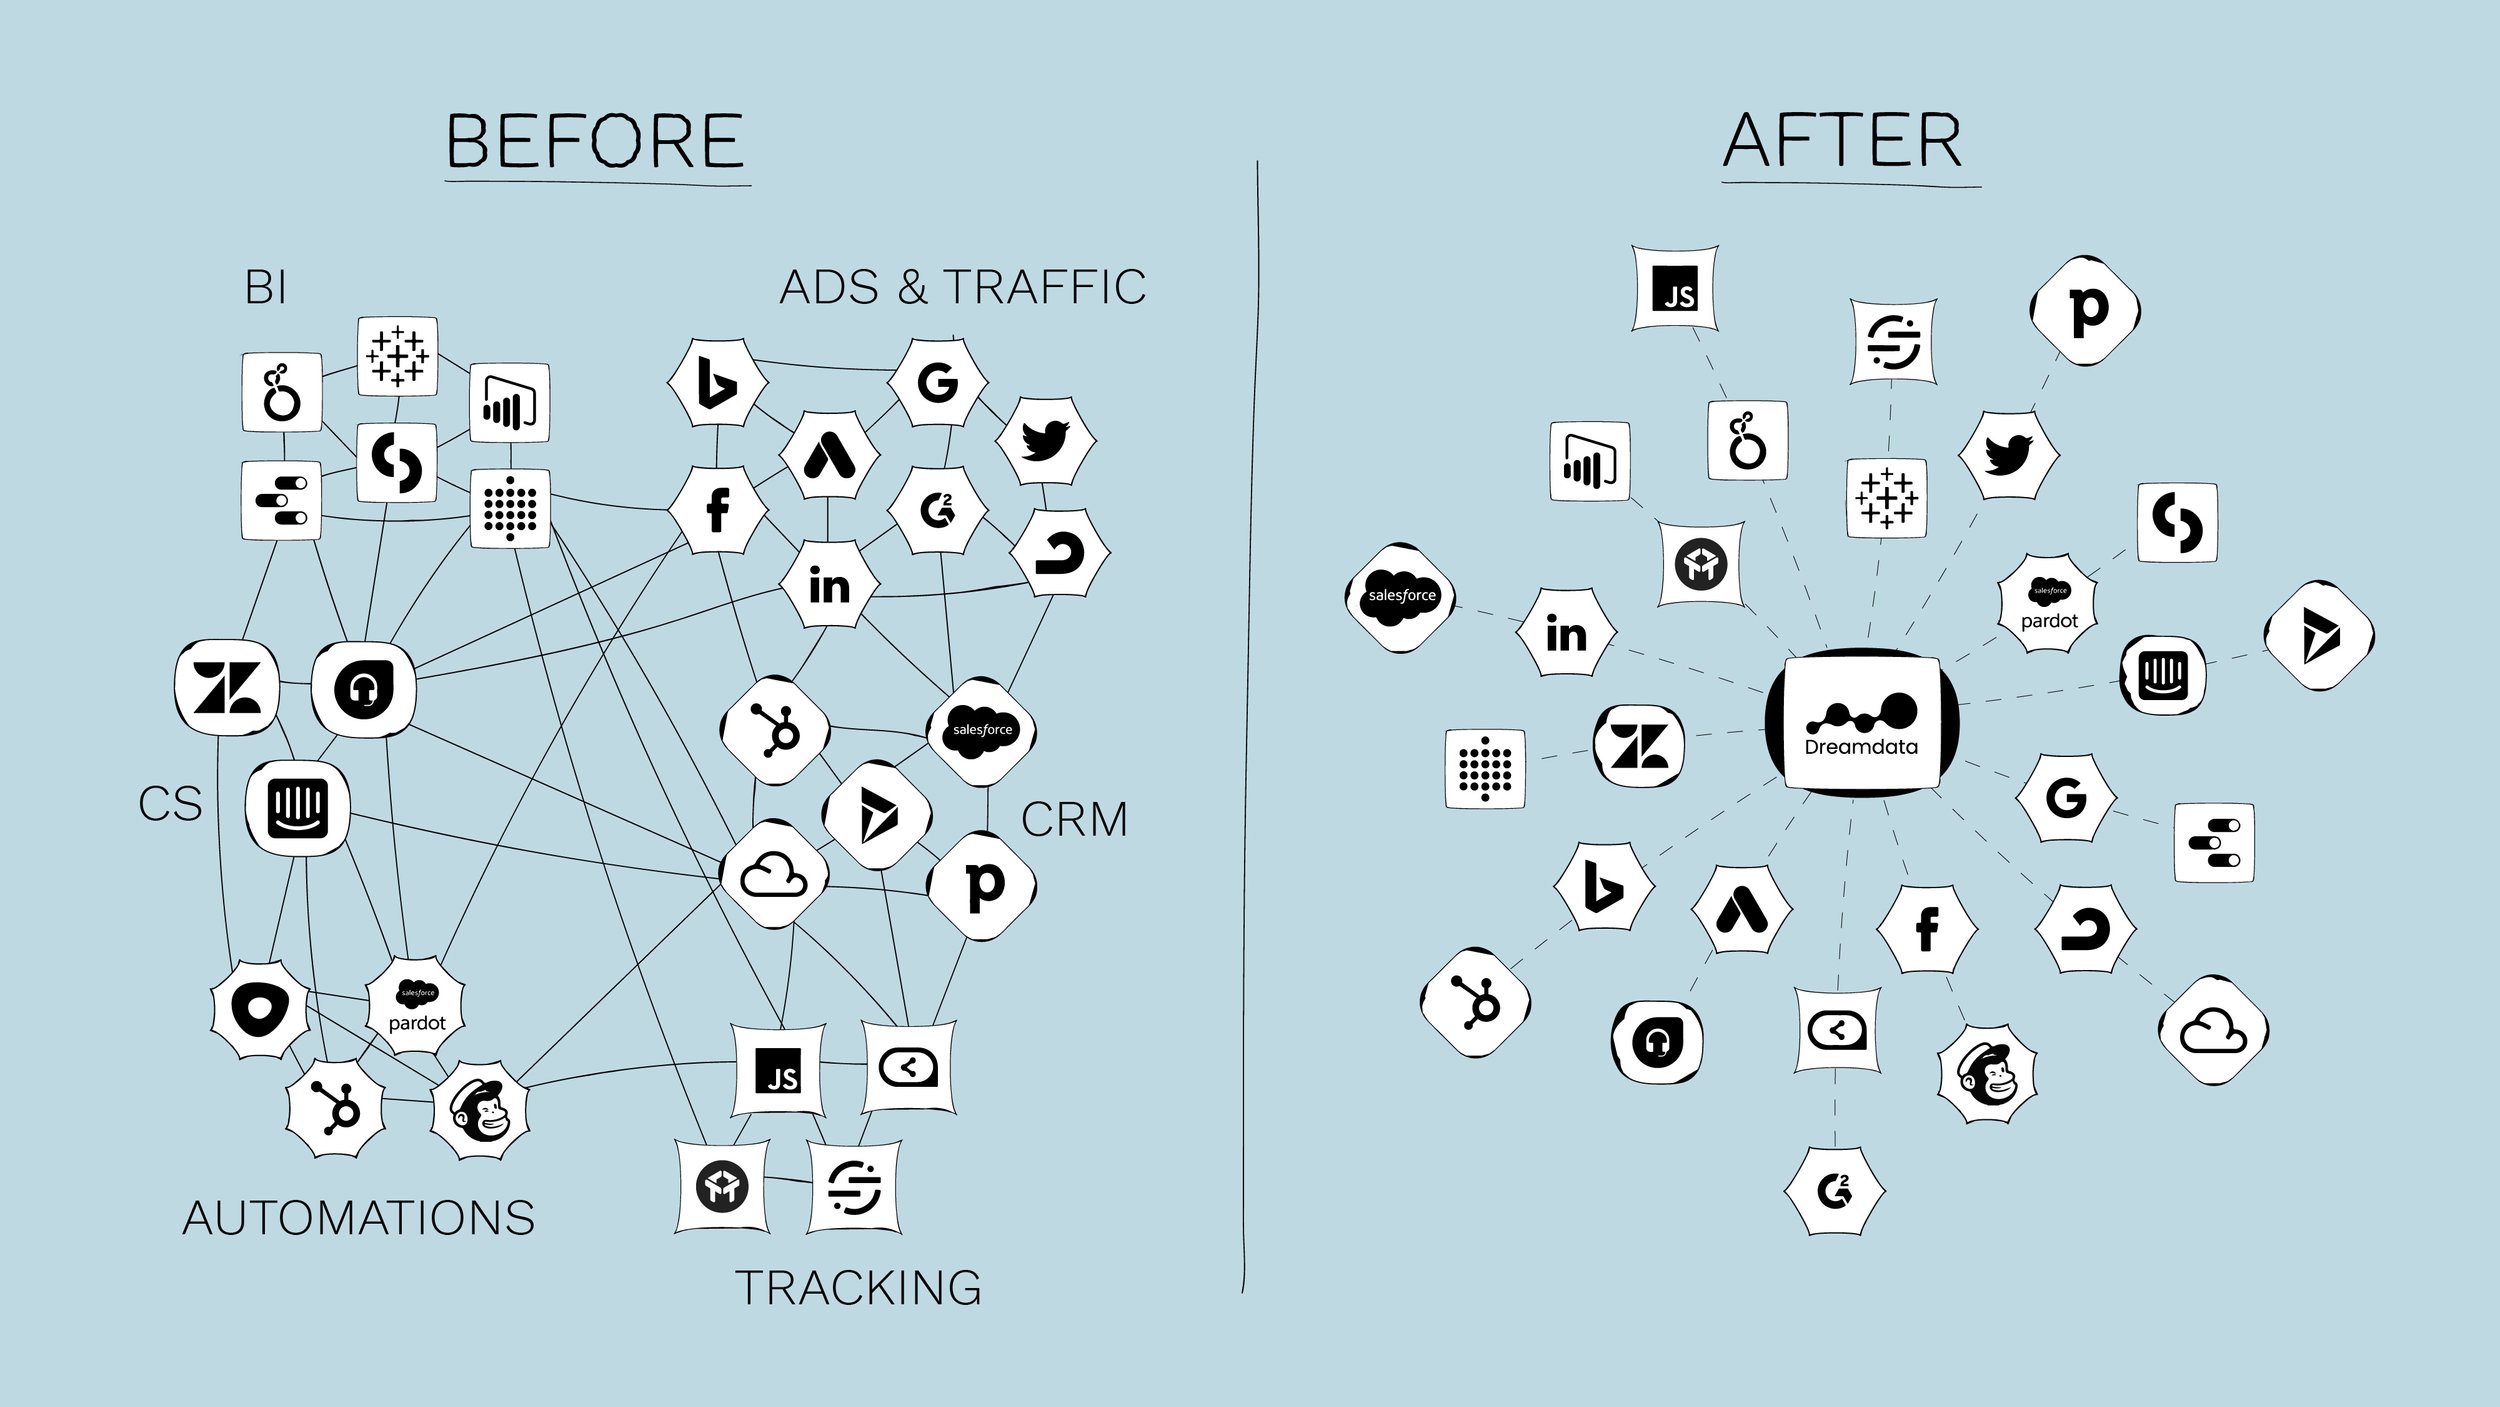
Ideally, you can put together a customer journey map like Dreamdata’s Journeys where you can visualise all the touches taking place in the journey for a better visual overview.
Once you’ve addressed the question of data you can move onto the pipeline velocity metrics.
Step 2 - Grow the number of leads in your pipeline
The headline metric in the pipeline velocity formula is the number of leads in your pipeline.
This is, of course, the growth metric every business on the plannet focuses on. More customers = more money.
Easier said than done though… else we’d all be working in unicorns.
There are two primary sticking points. Firstly, it’s rarely possible to capture more leads on demand. Secondly, not all leads are good leads.
For a B2B go-to-market team, getting more of the right leads into your pipeline requires the following three ingredients:
1. A data-based Ideal Customer Profile and Qualification criteria
To get the right leads into your pipeline you need to have a clear understanding of what ‘right’ actually means.
The first step is to have anup-to-date Ideal Customer Profile (ICP). Look at the data behind the customers you’ve closed - in particular the ones you’ve closed most efficiently. What ties them together? Industry, size, location?
Note, your customer base will change as your product grows and the market changes. So make sure to keep your ICP as up-to-date as possible.
Check out this Gartner article on the importance of ICP.
The second step is setting up a funnel that quickly filters out any undesirable leads.
That is, you want to avoid having a large number of unqualitfied leads coming into your pipeline and wasting your Sales team’s precious time.
Use a qualification criteria early in the pipeline, such as a ‘Sales Accepted Lead’, which fit your ICP perfectly.
You can read more about setting up a go-to-market funnel in this post.
2. Diverse go-to-market strategy backed by performance data
The second ingredient is the means of capturing your leads.
Once you know who’s the ideal audience to target, you can adapt your go-to-market strategy towards these accounts.
If you’ve already been pulling in some of these ideal accounts you can use your customer journey data (recall step 1 above) to tell you the touchpoints that led those successful ICPs to purchase.
What content did they view? What ad campaign did they click on? Did they come through a Review Site like G2?
When you’ve identified the winning motions, you can scrap the efforts which had no impact on generating pipeline and double-down on the ones that did.
Note however, that pushing up this number might require time and money to deliver results.
If you’re looking to keep cost down while keeping your pipeline and revenue healthy, you’ll be interested in this post.
3. Sales and Marketing alignment
Any conversation about B2B pipeline velocity needs to include Sales and Marketing alignment.
After all, pipeline is the product of Marketing and Sales efforts working in tandem to capture and nurture accounts.
As the preceding ingredients already suggest, you can’t really have one without the other, at least not if you want to accelerate growth in any meaningful way.
Every chink in that chain is a delay in pipeline.
You can dig deeper into Sales and Marketing alignment in 10 practical ways to align sales and marketing here.
Step 3 - Increase your Sales win rate
Once you’ve got your qualified leads flowing into the pipeline, you can start pushing the next lever: making sure as many of them as possible are won.
When looking at win rates it’s also really important to bear in mind that even a slight uptick in win rate can have a noticeable impact on your pipeline velocity.
For this you need two things in particular:
1. Understand why you’ve lost prospects
First you need to look back at your historic data to understand where and why you’ve lost prospects before.
You need to examine if there’s a pattern of where they’re dropping out of buying. This can help you identify if you’ve got a particular weakness in your Sales process and set you on course for addressing it.
You also need to figure out why they’ve opted out of buying. Is it a product deficiency, pricing, communication, etc? This means you need to reach out to them and discussing what they thought were your biggest shortcomings.
2. Well defined pipeline stages and constant performance tracking
The second thing you need to have in place are well-defined pipeline stagesand
For this you need to set up the stages and conversions that make most sense for your business model. You also need to track how long leads are taking in each stage so that you can push those lagging behind.

Once you have these stages in place, you need to put into use that performance tracking data we mentioned in Step 1 to assess whether or not your efforts at each stage are actually working or not.
In particular you want to be looking at:
Email performance - are your emails being delivered and received by prospects as desired?
Content performance - is the content your prospects are consuming informing them about the product or service as you expect? You want to make sure they’re clear about how your company solves their problem and why you’re better than the competition.
Meetings performance - are your meetings actually helping in moving the deal along?
Step 4 - Shrink your Sales cycle
The next metric on the formula is the length of the sales cycle.
Bringing down the length of time it takes to close deals requires a mix of having the right accounts in the pipeline (Step 2), knowing your funnel inside-out, and reading all the signals that can help you close deals fast.
1. Get the fastest accounts into your pipeline
As outlined in Step 2 above, your ICP should take into account those accounts which close fastest. Moreover, as set out in Step 3, your pipeline should filter out any undesirable leads before Sales devotes any attention to them.
These steps will already allow you to be getting the fastest leads onto your pipeline. And so help you shrink your sales cycle.
With that said, this doesn’t deal with the question of pushing these leads even faster once they’re in the pipeline. So here’s the what you can do 👇
2. Get intimate with your customer journey
Knowing your customer journey, and what drives what and when, is a sure way of identifying which accounts are going to be moving to the finish line quickest.
For example, this report found that journeys which have a first-touch on Review Sites are 63% shorter than the average B2B journey.
If your own customer journey data also shows that certain touches signal a faster journey, you must ensure this data intelligence is incorporated into your Sales prospect prioritisation.
Equally, this data can help identify previous touches which have done little to move the deal along, or worse - think unnecessary meetings, ill-timed emails, ineffective calls. Use this data to optimise or kill those efforts that aren’t actually contributing to anything and focusing on the ones that have.
Finally, knowing your average customer journey intimately also helps forecast better, manage expectations, and ensure cross-team collaboration (recall Sales/Marketing alignment in Step 2).
3. Read those signals

As with data from historic customer journeys, live data from ongoing cycles is extremely valuable.
This data, sometimes calles Sales intelligence, enables Sales teams to easily identify any redflags, such as a prospect comparing your product with a competitor on G2 (more on G2 intent data here) and improve their performance.
For instance, perfecting the timing of outreach following a touch the account has had so that they don’t slip off the radar. Or personalising messages to offer that extra care and thoughtfulness that accounts appreciate. Learn more about working with Sales intelligence data in this post.
The bottom line is that data can help you make the Sales cycle more efficient in small increments. And even if it’s a day or two, the impact on the overall pipeline velocity value will be noticeable - especially when combined with the other steps!
Step 5 - Increase the average deal size
The last of the metrics in the formula concerns your average deal size.
However, unlike the previous metrics, your deal size is influenced more heavily by wider (external) variables. On top of this, it also needs to be kept more stable than the other metrics and cannot realistically be put up every month or quarter.
Leaving the discussion of pricing models for another time, there are some motions to bear in mind that can help bring this metric up without changing your pricing.
In the main, you need to make sure to sell your product at the highest possible tier. This means waving goodbye to excessive discounts and other price shifting; the price, is the price.
However, you can only move to this approach if your prospects are fully aware of the problem you’re solving, and all the challenges they’re presently facing.
Effective communication and consistent messaging -throughout the customer journey and across all media - is vital in making sure this is the case.
Step 6 - Develop a pipeline velocity strategy
Finally, you need to develop a strategy that puts these steps into practice in a structured, consistent and holistic way.
Structured
Tracking and optimising the metric involves time and resources. Which means that your strategy needs to encompass processes and budget allocation to meet the needs of the respective efforts.
Making changes, especially to sales processes, can be uncomfortable. Being systematic in your strategy and implementation will enable you to make any changes as seamless as possible.
Consistent
As mentioned in this article’s intro, pipeline velocity is a relative metric, it is changes in the value between a given time frame that makes it a valuable benchmark. So being inconsistent about running the analysis - and improving your pipeline - defeats the purpose.
So be consistent across the go-to-market organisation when drawing a focus on pipeline velocity.
Holistic
The whole go-to-market team needs to be included. It’s too common for go-to-market teams to view the customer journey (only) through their own lens - with Marketing fixated on their funnel and Sales on their individual pipelines.
Your strategy needs to overcome these barriers by incorporating all teams, keeping consistent aims and by singing from the same (data) hymn sheet.
With all this in hand, you’re now ready to make the most of the pipeline velocity formula and accelerate your pipeline.