
Dreamdata launches Digital Analytics: the B2B alternative to Google Analytics

A new product has landed! We’re thrilled to announce the full release of Digital Analytics!
Digital Analytics tracks and measures site engagement at the account level and connects data from across your ad networks, making it the perfect first step for B2B go-to-market analytics.
In this post we’ll cover all of Digital Analytics’s main features and why it offers B2B marketing teams the best alternative to GA4.
You’ll learn:
Why B2Bs have been ignored in web analytics
How Digital Analytics is tailored to the B2B user
Advanced Impact Analytics: measure influence on leads
GDPR-compliant web analytics
An intro into the Digital Analytics dashboards
Realtime
Events
Pages
Segmentation
Cost
How to get started with Digital Analytics
B2Bs’ needs have long been ignored
B2Bs’ unique needs have been largely ignored in the web analytics space.
Platforms like Google Analytics have been set up to cater almost exclusively for e-commerce, B2C users. With a focus on tracking only individual visitors and conversions - and not business outcomes - they have left B2B go-to-market organisations with a significant gap.
In fact, there are three main limitations with existing web analytics providers like GA4:
1. Visitor-based tracking ignores the account-based buying journey of B2Bs
B2Bs sell to accounts consisting of multiple individuals.
This means that it’s the account that converts, the account that moves down the pipeline and the account that buys.
Or to flip it around, it’s the account that the B2B marketer cares about.
Yet, the sole unit of focus for existing web analytics platforms is the individual visitor. It’s individuals’ conversions and visits that are measured, and it’s individuals who are identified.
No account-based data segmentation
A corollary of not tracking accounts is not being able to cut and slice the data on business (‘firmographic’) criteria. That is, not being able to narrow down the data into business segments such as company size, industry and location, and analyse the performance of these segments.
2. Performance metrics also tailored to accounts
The individual-visitor focus also carries significant implications on performance metrics.
For instance, you might find that two, or more individuals from the same account perform a conversion event, e.g. request demo and free sign up.
All of a sudden measuring individual-based conversions presents a skewed reality.
You’ll be counting two or more conversions where actually it was only a single account that converted.
3. From conversions to sales pipeline
But even account-based conversions as a metric don’t paint a complete enough picture for the B2B marketer.
Conversion events such as demo booking or free sign-up might show that accounts are interested in learning more about your product. But how much does that say about business value?
Sure, knowing that someone visited your site and submitted a form gives some clarity. But what about everything that happens next? Did they become a lead? An opportunity? A won deal?
B2B marketers need to be able to tie all their tracking data to business objectives further downstream, i.e. pipeline and revenue generated.
You might be interested in this post on using MQLs to build quality pipeline→
Only then can the marketer know with certainty that a channel, landing page, blog post, etc. performed well.
And while many B2Bs have been able to manage ‘well enough’ with this B2C-focused setup, they have been unable to reap the benefits of a dedicated B2B Google Analytics alternative.
Digital Analytics: the B2B alternative to GA4
Dreamdata’s Digital Analytics has been designed entirely with B2B needs in mind. From tracking to analytics reporting, it’s the B2B marketer who’s the only focus.
Let’s take a brief look at what’s under the hood - once you’ve installed Dreamdata’s tracking scripts. ⤵
B2B customer journey tracking
Dreamdata uses first-party tracking to track and identify visitors’ source and activities on your website. This includes identifying users and their company credentials with a combination of form submits and reverse IP lookup.
Dynamic tracking and data enrichment
Dreamdata then continues adding data on the user’s sessions throughout their journey. Including data from other devices and data from other users in the same account.
The result is an enriched user and account profile, which, in the paid plans, can be viewed as a detailed B2B journey map.
B2B web analytics
By tracking you to measure account-based metrics, such as account conversions, traffic, engagement, etc. (more on this below)
This gives you insight into the people engaging with you as well as the company they represent.
Advanced Impact Analytics
The B2B customer journey continues beyond the simple conversion event. With Dreamdata’s Digital Analytics you can see the influence of site engagement on your pipeline.
Simply set up custom pipeline KPIs based on real business goals so you know the real impact of your site.
For those users on the Team or Business plans, your pipeline KPIs are tied to your CRM stages. So that you reflect the exact customer journey.
GDPR-compliant web analytics
As EU data privacy regulations continue to tighten, US-based analytics providers like Google Analytics have been placed under greater scrutiny by regulators.
All Dreamdata tracking and identification is first-party and consent-based - and the data never leaves the EU - meaning that it’s GDPR compliant by design.
This essentially means that with Dreamdata you can collect, store and analyse your web data without having to worry about the privacy of your customer data.
Digital Analytics: an intro to dashboards
Dreamdata users will find all the Digital Analytics dashboards under the Engagement tab on the navigation menu.
The other menu items relate to Dreamdata’s leading Revenue Attribution and Analytics and Customer Journey products and features.
Real-time
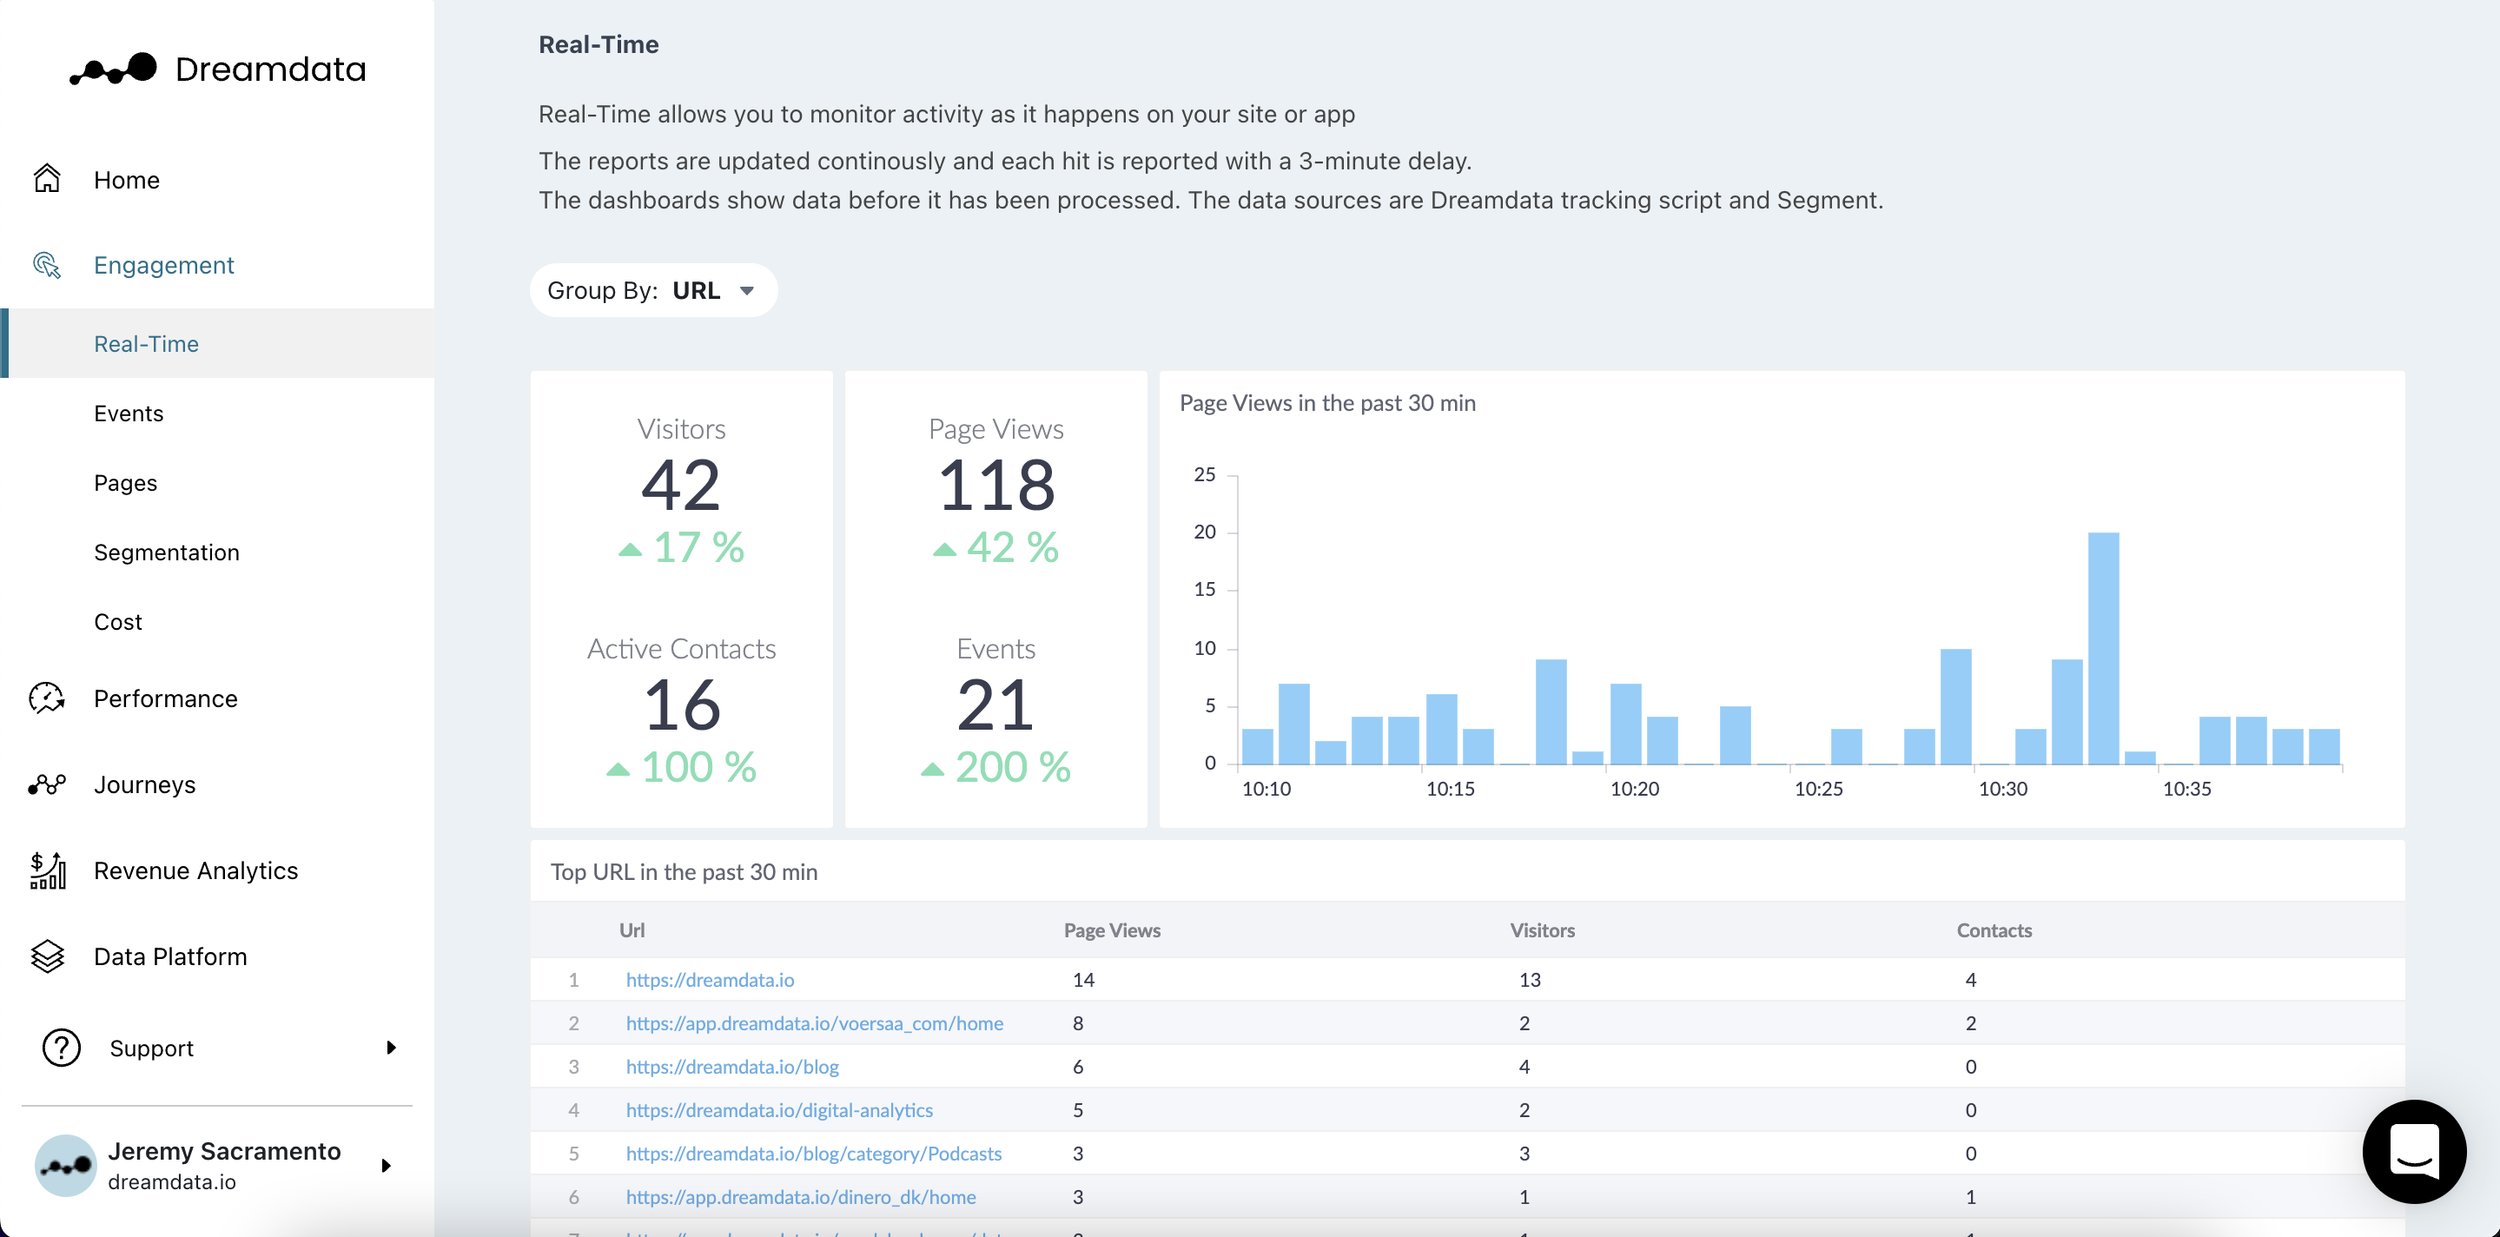
The Real-time view dashboard enables you to monitor what’s happening on your site right now. This includes measuring any events - such as page visits and conversions - that are taking place.
You’re also able to filter by Source, Medium and Campaign and see whether any events (e.g. demos or sign-ups) are taking place.
AND, thanks to Dreamdata’s tracking script identify, in Real-time you can monitor if any of the active users are active contacts (identified users). Meaning you can test whether a retargeting campaign is bearing fruit.
Events

The Events report measures visitor engagement across your website, app or offline events; allowing you to identify what activities lead to conversions, pipeline and revenue.
The Events report analyses all the touchpoints that are tracked over a given time period. For example, you can examine the number of demo bookings over the past year, and dig into deeper insights such as who’s performed those events and what their source channel was prior to converting.
What’s best, with Events you can view advanced impact analytics and discover how traffic and conversions impact on pipeline and revenue - at the account level!
Pages

The Pages report puts the focus on the performance of each individual page. How much traffic does each page generate? What are visitors doing? Are they converting? Are they hanging around for a while? Where are they coming from?
Here you can dig deeper with advanced impact analytics to see whether pages are impacting your pipeline KPIs.
Similar to Events (above), on Pages you can segment each page by Channel, Source, Campaign, Referrer etc. to gain insight into the channels that people use to arrive at a specific page.
Segmentation
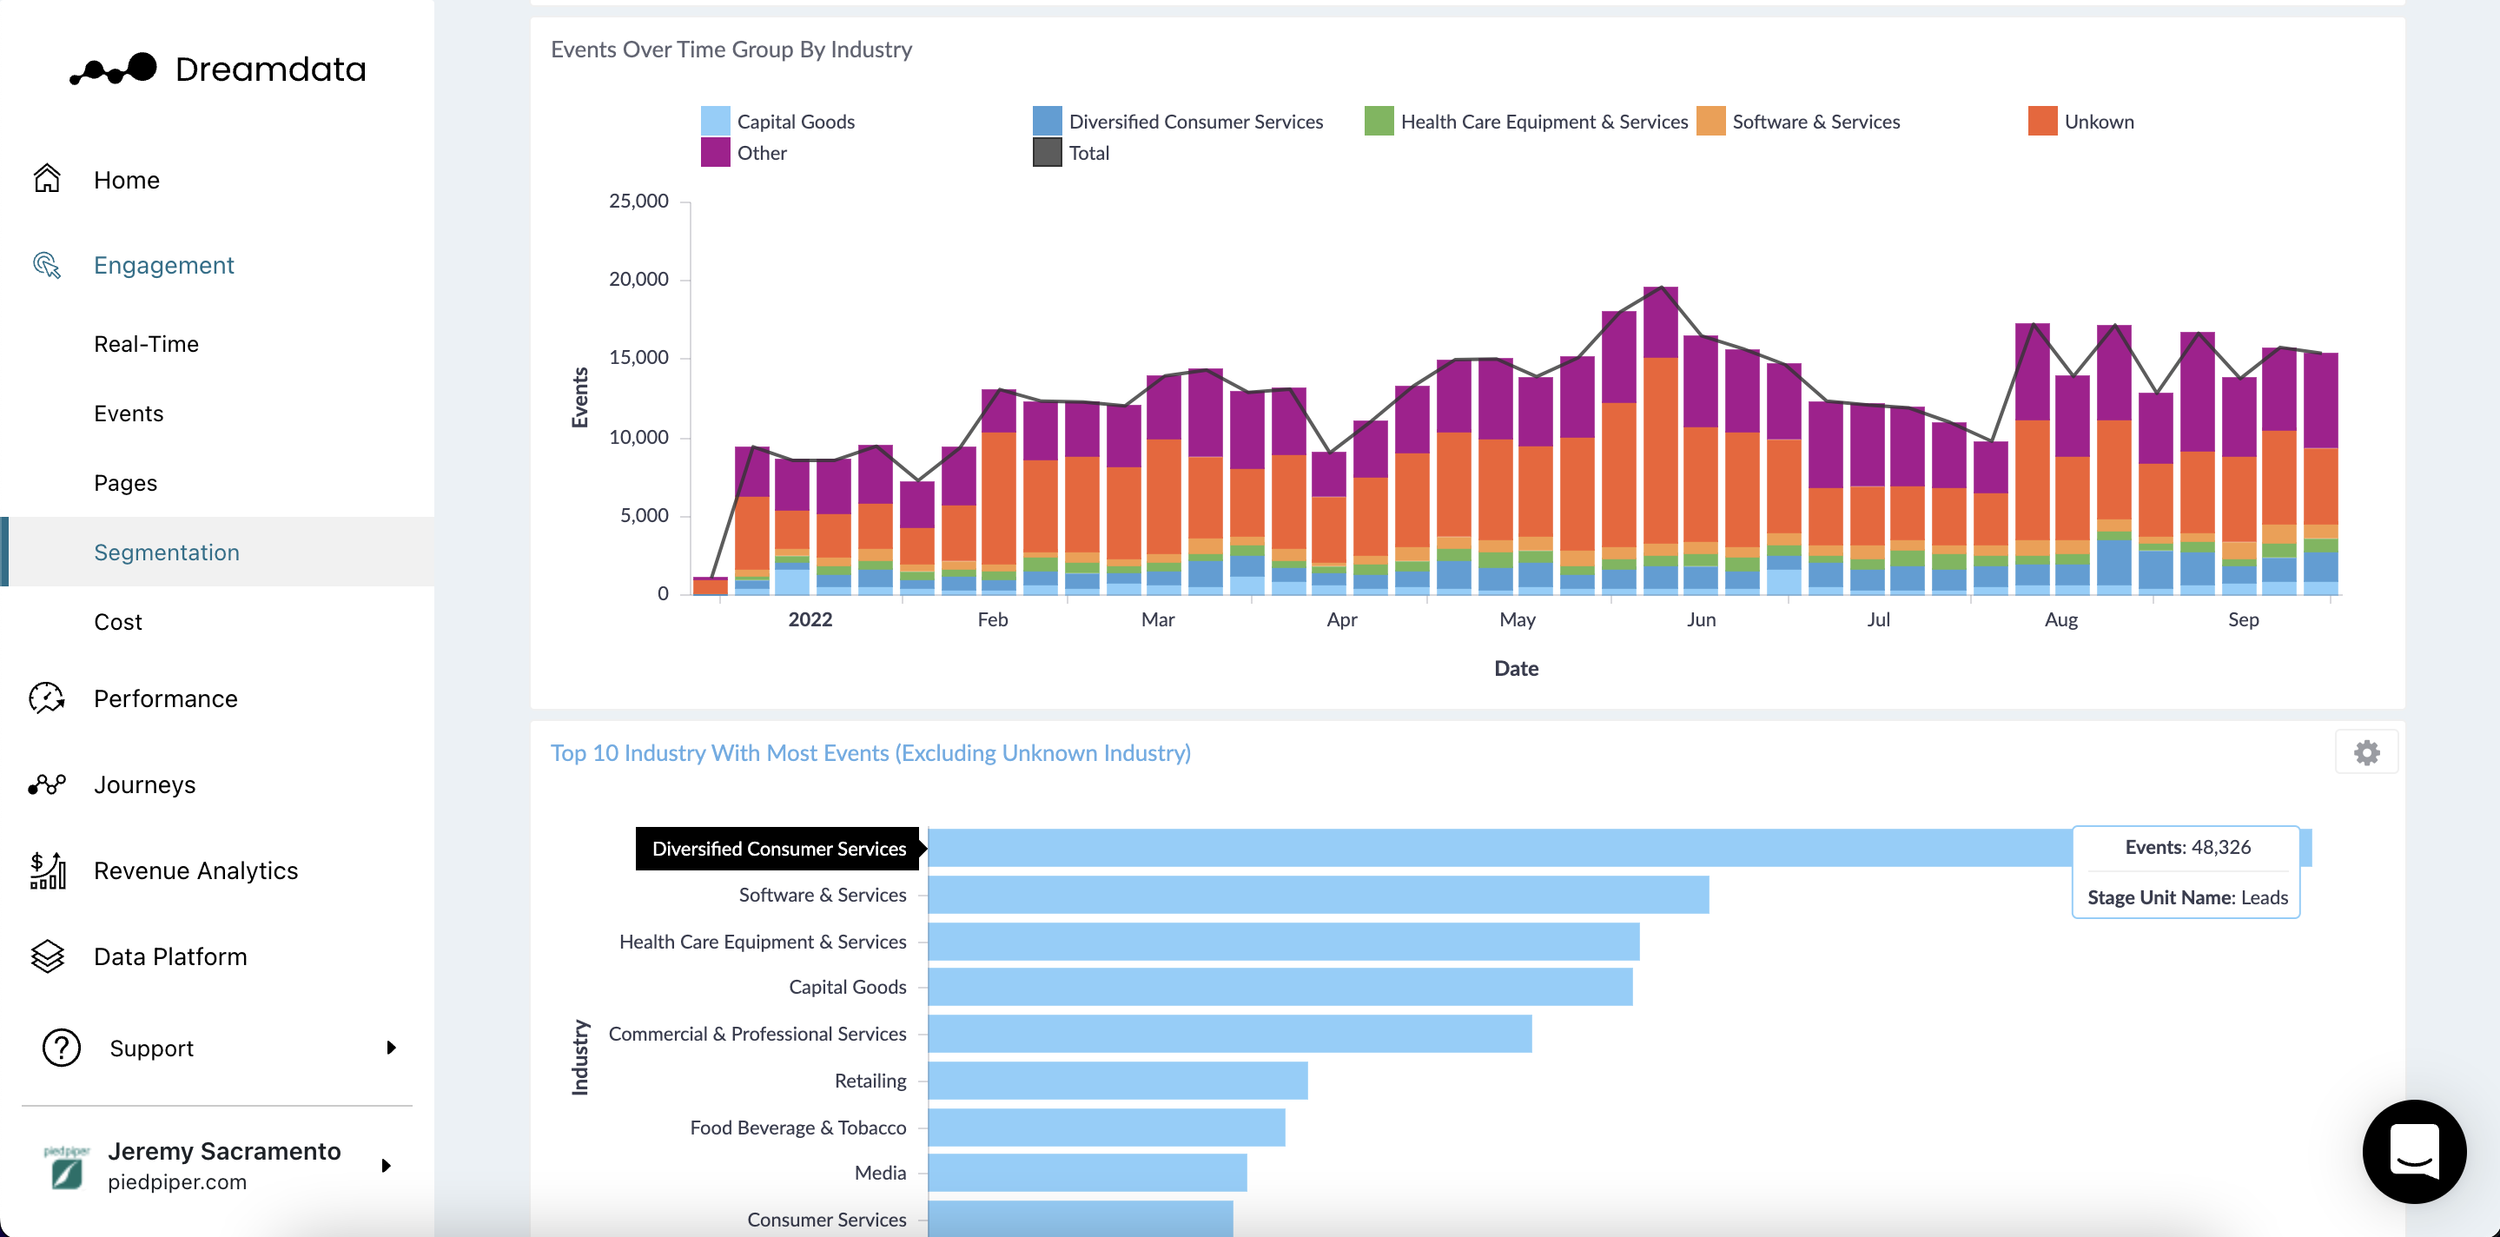
The Segmentation report focuses on the ‘who’ behind all the activity on your site.
The reports give you a detailed break-down of the people engaging with your site, including:
geographic data - where the site visitor is,
technographic data - what device and browser they’re using, and,
firmographic data - (the fundamental B2B one)
Unlike the previous reports, where you segment according to events or pages, the Segementation report cuts across all engagement.
To identify the best-performing segments, each segment is summarised based on total counts of views, visitors and companies as well as conversion and pipeline performance.
This not only allows you to learn about the characteristics of your visitors, but can help you activate your ABM, retargeting campaigns, etc.
Cost
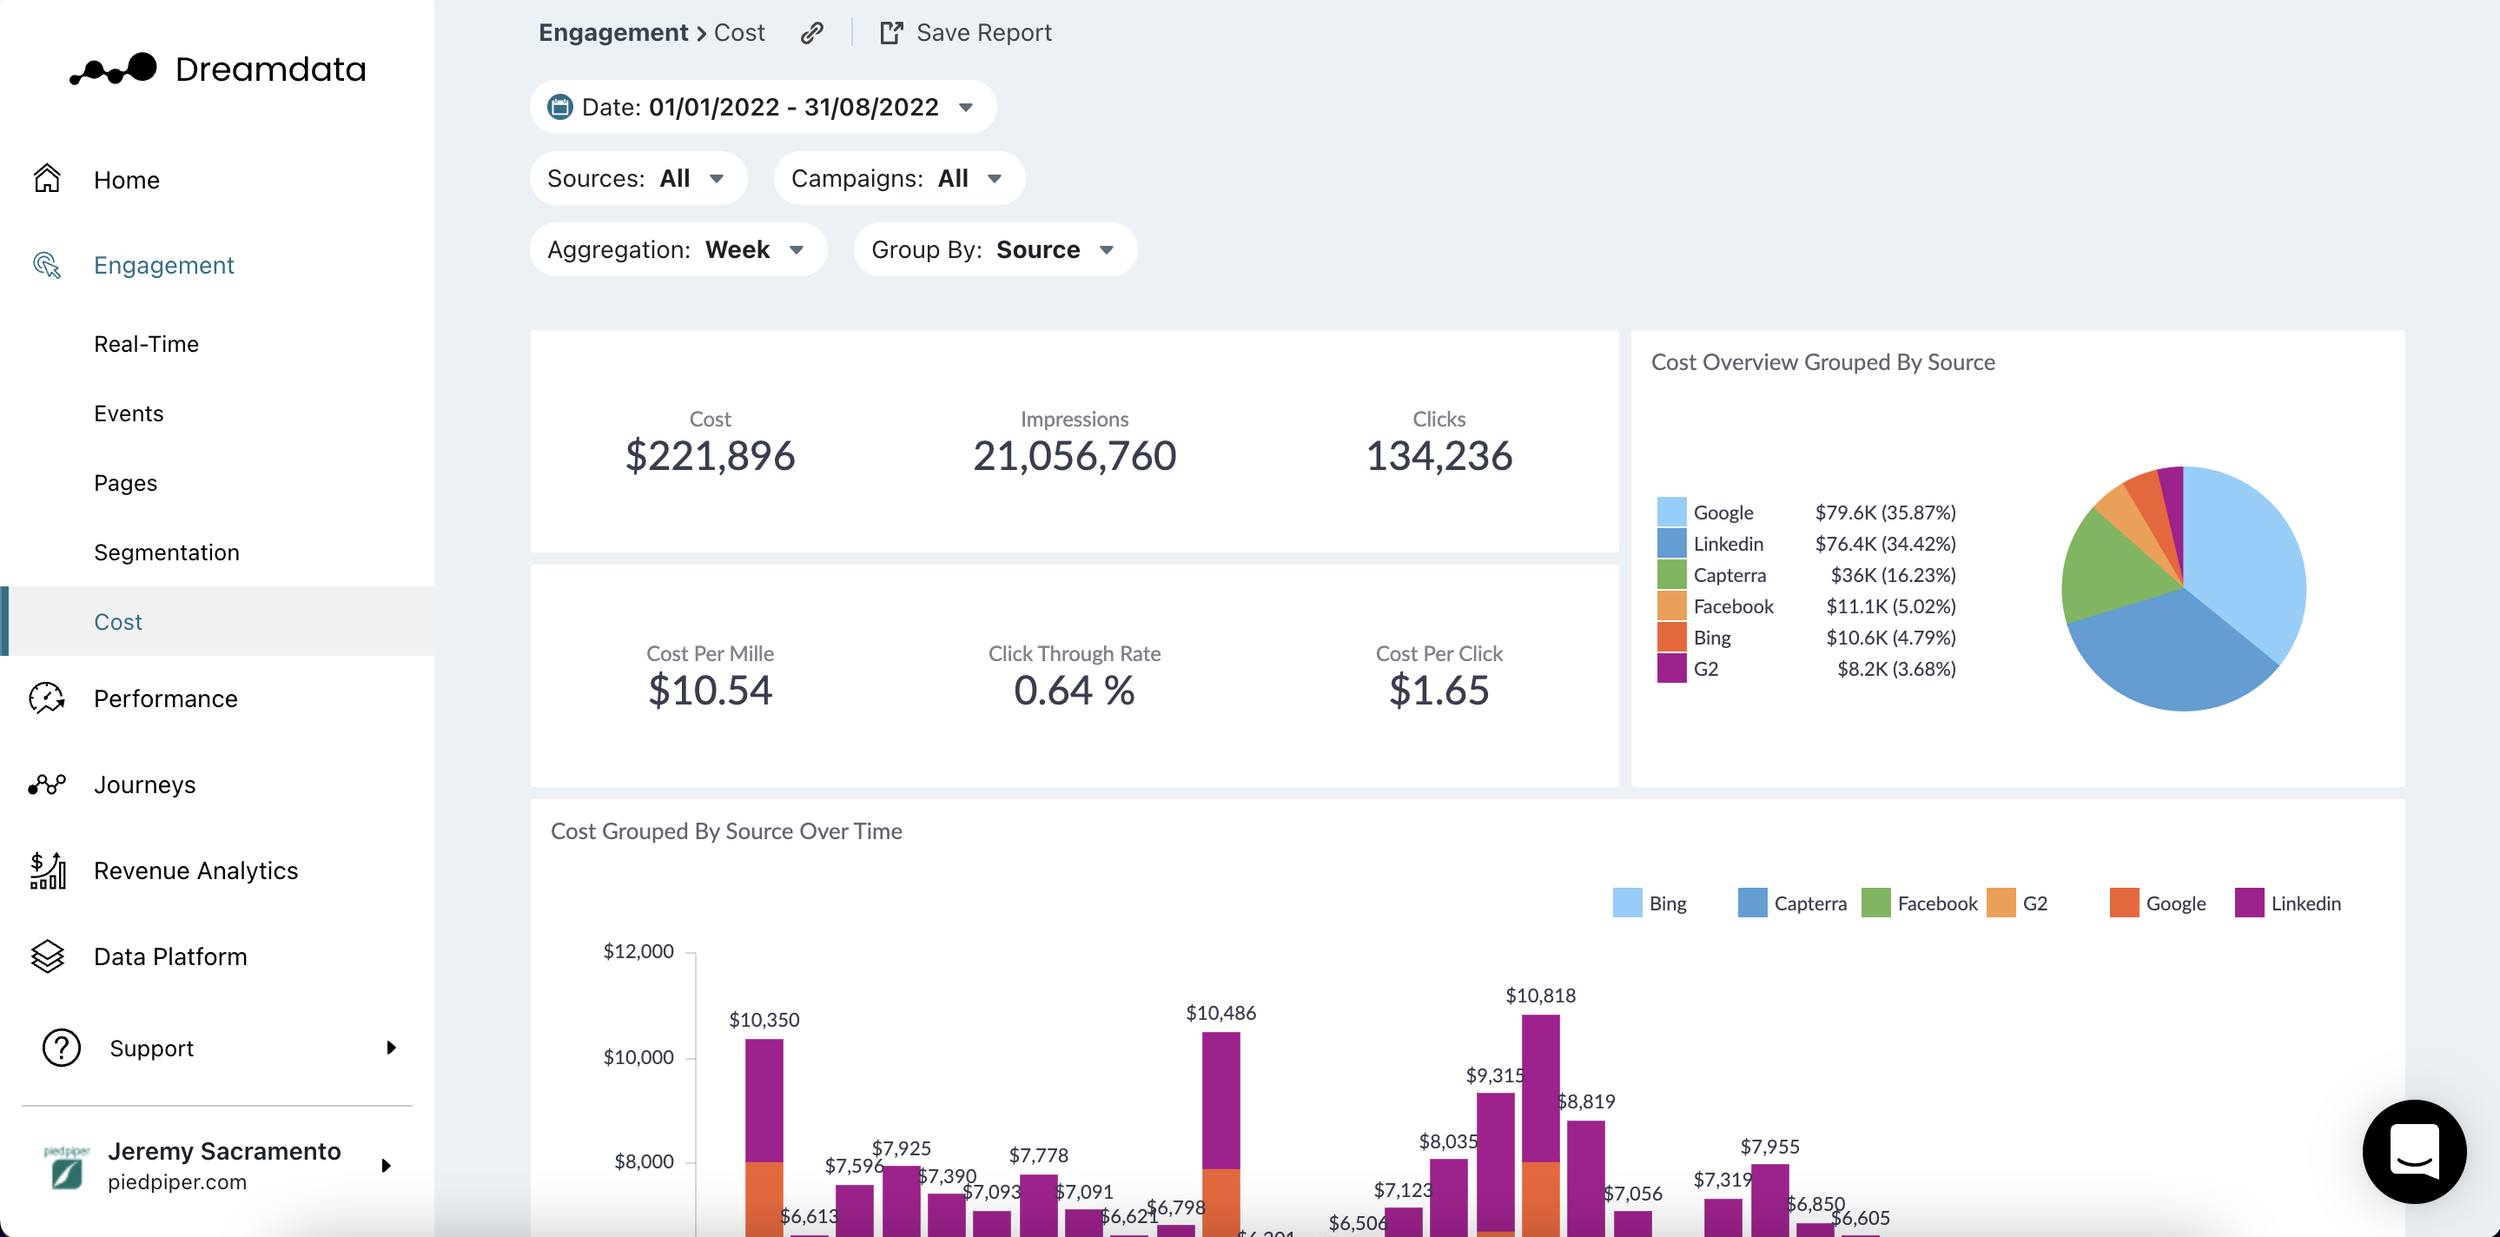
The Cost report is the home of your ad spend. Here you can integrate data from 5 ad networks: Google (incl. Google Search, Google Display & Youtube ads), LinkedIn, Facebook, Capterra and G2.
You’re then able to gain a unified overview of your ads cost in total as well as by each individual ad network, including the familiar ad metrics: Cost per Mille, Cost per Click as well as the Click-through rates.
Say goodbye to the endless hopping from one ad network to another!
How to get started with Digital Analytics?
Dreamdata’s Digital Analytics is Free, and couldn’t be easier to set up. Here’s how 👇
1. Sign up for Dreamdata Free
2. Install Dreamdata’s tracking script.
You can find instructions for installing your script here →
3. Set your custom conversions and pipeline KPIs.
You can find instructions for setting these up here →
4. Optimise your B2B go-to-market for success.🚀
And remember, Digital Analytics is just the first step. Connect all your go-to-market tech stack and see what’s really driving your revenue.