
B2B go-to-market benchmarks 2022

The average B2B customer journey takes 192 days from anonymous first touch to won - that’s over 6 months!
In this report, we’re sharing a number of relevant B2B go-to-market benchmarks using data aggregated from our platform.
We cover:
We all know how busy go-to-market teams are; pulling every lever at their disposal to bring the length of their customer down, push accounts through the pipeline, and rake in the revenue.
For this, most teams are tracking a number of key go-to-market metrics which help identify best performing journeys and optimise accordingly.
But besides these internal insights, there is the external dimension of industrywide benchmarks which can help better inform and contextualise performance.
How long is the average B2B customer journey for SaaS? How many touches do accounts have on average before crossing the line? Does company size impact the customer journey?
Unfortunately, these B2B go-to-market benchmarks haven’t been available. Until now…
We’ve put together this report to go over some of the B2B go-to-market benchmarks we’ve analysed using data aggregated from our platform.
A quick word about the data behind the benchmarks
The data used to compile these benchmarks is anonymised aggregated data* taken from a sample of 414 active Dreamdata Free user accounts.
You can read more about how Dreamdata pulls and enriches data on industries, size, etc. And about tracking more generally here.
* At Dreamdata we take data security and privacy very seriously. Dreamdata has processed only non-PII data for this study. The data insights are aggregated, meaning it is not possible to identify individual companies. Only data from companies that have agreed to let us use data in benchmarks are included.
B2B customer journey length benchmark: How long does the average B2B customer journey take?

Customer journey length - otherwise known as the time-to-revenue metric - is a fundamental metric for any B2B go-to-market team.
It helps plan strategies, forecast and predict revenue, assess how long you need to run experiments and a host of other things which you can read all about in this time-to-revenue article.
But how does your journey compare with other B2B companies?
From our data, we find that the average customer journey takes 192 days. That’s over 6 months from the very first anonymous touch to closed-won.

And the range we find in our data is staggering. For instance, one of our own customer journeys at Dreamdata took over 1,100 days from first touch to revenue. Read the story here.
But does the industry you’re in impact the length of the journey? What about the size of the company or its location
Let’s take a look at what our data says.
B2B SaaS companies have 2x longer customer journeys than B2B media companies
We see that the length of time it takes to close deals differs considerably between industries.
For instance, it takes 2x as long to close deals in B2B SaaS as it does for B2B commercial and professional services companies.

We also find that although B2B Media companies have speedy early-pipeline stages, opportunities stay on the final stage for almost 3x longer than B2B commercial and professional services companies.
Three B2B industries
Note that we’re only showing data for the three most statistically significant industries using Dreamdata. Are you not within any of these industries and wondering how long your peers’ journeys are? Feel free to reach out.
Main highlights:
B2B Commercial & professional services
First-touch to sign-up/demo = 31 days
First-touch to opportunity created = 64 days
First-touch Won deal = 105 days
B2B Media
First-touch to sign-up/demo = 16 days
First-touch to opportunity created = 35 days
First-touch Won deal = 115 days
B2B SaaS
First-touch to sign-up/demo = 56 days
First-touch to opportunity created = 154 days
First-touch Won deal = 233 days
Want more benchmarks like these?
Large B2B companies take 64% longer to close deals
Company size also has a bearing on the length of the customer journey. From our data, we notice that customer journeys are the longest for large companies (>250 employees). These are approx. 64% longer than small-sized B2B companies. So make sure the deal size of the larger account is worth it.

Looking at the length of time customers take at different pipeline stages, we see that small B2B companies have the shortest first stage, but the longest middle stage. Which means that customers spend more time being nurtured after being qualified as an opportunity than in larger (likely, more established) businesses.
Main highlights:
Small (<50)
First-touch to sign-up/demo = 27 days
First-touch to opportunity created = 72 days
First-touch Won deal = 147 days
Medium (51-250)
First-touch to sign-up/demo = 57 days
First-touch to opportunity created = 72 days
First-touch to Won deal = 135 days
Large (>250)
First-touch to sign-up/demo = 67 days
First-touch to opportunity created = 96 days
First-touch Won deal = 242 days
US-based B2B companies have the shortest customer journeys
Our analysis also shows that the location of businesses similarly appears to have a bearing on the length of journeys. (Although we note that this data may be impacted by skews in the ‘type’ of businesses using Dreamdata in different regions).
From our data, we see that European B2B companies’ customer journeys are on average 70% (82 days) longer than US companies to purchase.

Main highlights:
EU
First-touch to sign-up/demo = 36 days
First-touch to opportunity created = 142 days
Won deal = 199 days
US
First-touch to sign-up/demo = 31 days
First-touch to opportunity created = 39 days
Won deal = 117 days
Do you know the length of your customer journey?
Find out today with Dreamdata Free
B2B customer journey touches benchmark: How many touches are there before closing a deal?
The fact that the B2B customer journey consists of multiple touches is well known.Tracking and measuring these touches, with tools like Dreamdata, helps go-to-market teams identify the best-performing channels, campaigns and content. Which they can then repeat and scale to generate growth.
With these tools, we can also learn how many touches take place on the journey. But, as has been highlighted by numerous Dreamdata users, how many touches are many, and how many are few? From our data, we see that on average, across B2B industries, there are 31 touches before a deal is closed.

Now let’s see how this differs between segments.
B2B SaaS have the most touches in their customer journeys
We see that B2B SaaS and commercial & professional services have comparatively similar touches in their average customer journeys. Which themselves are pretty much around the overall average of 31 touches.

B2B Media companies, however, have on average -50% fewer touches in their customer journeys.
Main highlights:
B2B Commercial & professional services
First-touch to sign-up/demo = 2
First-touch to opportunity created = 8
First-touch Won deal = 29
B2B Media
First-touch to sign-up/demo = 2
First-touch to opportunity created = 5
First-touch Won deal = 15
B2B SaaS
First-touch to sign-up/demo = 3
First-touch to opportunity created = 8
First-touch Won deal = 34
Mid-sized companies have more than 20% the number of touches than larger B2Bs
Curiously, we find that large companies have -17% the number of sessions (avg. 29) in the buying cycle than mid-sized companies (avg. 35).
We also see that the number of touches in the opportunity stage for mid-sized companies is 3.4x greater than large (and small) companies.

Main highlights:
Small (<50)
First-touch to sign-up/demo = 3
First-touch to opportunity created = 8
First-touch Won deal = 22
Medium (51-250)
First-touch to sign-up/demo = 2
First-touch to opportunity created = 12
First-touch Won deal = 35
B2B SaaS (>250)
First-touch to sign-up/demo = 2
First-touch to opportunity created = 8
First-touch Won deal = 29
Find out the number of touches on your customer journeys today
B2B account size benchmark: How many stakeholders does the average won account involve?
Unlike the typical B2C buyer, B2B customers are not single individuals but an account of multiple individuals, or stakeholders. This is what makes selling (and tracking) B2B customer journeys that much more difficult.
Tracking who’s actually involved in the buying process helps go-to-market teams improve targeting, personalisation, and keep on top of their Ideal Customer Profile (ICP).
But when you look at the accounts on your pipeline, how does the number of stakeholders (‘contacts’ as we label it in our data) compare with other B2B companies?
This benchmark is useful in tracking whether there are too many or too few stakeholders involved. We all know the adage, too many cooks spoil the broth. This applies also to B2B customer journeys. Too many stakeholders and the decision can drag out. Equally, too few and there is unlikely to be enough velocity in the deal.
Based on our data sample, we find that there are on average 1.9 contacts involved in an account’s journey.

How does this vary between industry, size and location?Let’s dive in.
B2B SaaS companies have an average of 2.3 stakeholders involved in their accounts
Compared to the previous benchmarks, when it comes to how many stakeholders are involved in the buying journey within each account, there are only small differences between industries. Particularly in the earlier stages of the journey.

With that said, B2B Media companies do, on average, see fewer stakeholders involved in their customer journeys. This coincides with the fewer number of touches (as shown previously above)
Main highlights:
B2B Commercial & professional services
First-touch to sign-up/demo = 1.2
First-touch to opportunity created = 1.3
First-touch Won deal = 2.1
B2B Media
First-touch to sign-up/demo = 1.1
First-touch to opportunity created = 1.2
First-touch Won deal = 1.5
B2B SaaS
First-touch to sign-up/demo = 1.2
First-touch to opportunity created = 1.5
First-touch Won deal = 2.3
Small B2B companies encounter fewer stakeholders in their accounts
For company size too, we see that the number of contacts (within the account) involved in the buying journey barely changes between business sizes. Although, mid-sized companies have more people involved sooner in the buying process when compared to small and large companies.
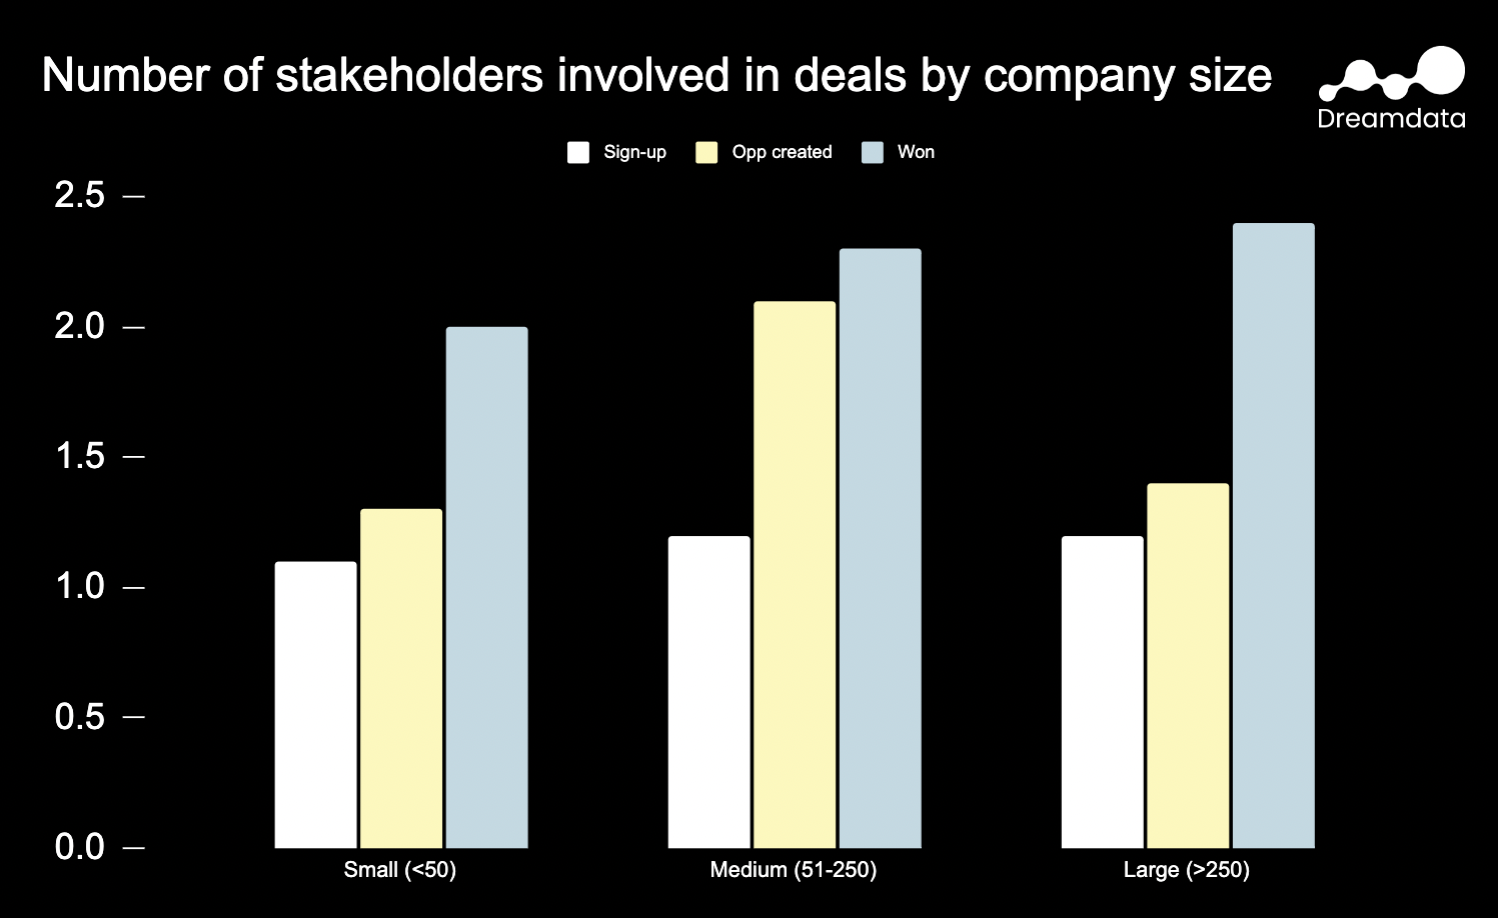
Main highlights:
Small (<50)
First-touch to sign-up/demo = 1.1
First-touch to opportunity created = 1.3
First-touch Won deal = 2
Medium (51-250)
First-touch to sign-up/demo = 1.2
First-touch to opportunity created = 2.1
First-touch Won deal = 2.3
B2B SaaS (>250)
First-touch to sign-up/demo = 1.2
First-touch to opportunity created = 1.4
First-touch Won deal = 2.4
How many contacts are involved in your customer journeys?
See now with Dreamdata Free
B2B first-touch benchmark: [bonus!] Does the first-touch channel influence the customer journey?
Most B2B companies are running some form of attribution, even if only with their CRM or through self-reported attribution.
The most common model being operated is first-touch attribution, which tracks and credits all success to the first recorded interaction a customer has with your brand. More on attribution models in this post.
From this, go-to-market teams can identify what channels, campaigns, content, etc. is performing best in capturing leads/ generating demand.
But how does the first-touch channel influence the journey that follows? Does it all?
With our end-to-end (multi-touch) customer journey tracking, we’re able to see how the first-touch influences the journey.
See here for more on why multi-touch tracking is so valuable to B2Bs.
Customer journeys where a Review Site is the first touch are 63% shorter than the average
The data points to very stark contrasts in customer journeys initiated by different channels. For instance, we find that journeys starting with a Social touch take over 5 months longer (217%) than those starting on a Review Site and (155%) longer than those starting with paid.
Read more about how Dreamdata uses G2 intent data in this article.

This might suggest that Social targets customers that are not necessarily in-market - which speaks to Demand Gen. Paid and Review Sites on the other hand are targeting in-market customers, and so taking less time to close.
Main highlights:
Paid
First-touch to sign-up/demo = 2 days
First-touch to opportunity created = 24 days
First-touch Won deal = 87 days
Social
First-touch to sign-up/demo = 5 days
First-touch to opportunity created = 35 days
First-touch Won deal = 222 days
Review Site
First-touch to sign-up/demo = 4 days
First-touch to opportunity created = 24 days
First-touch Won deal = 70 days
Customer journeys where Social and Review sites are the first touch, touch more channels before closing
A go-to-market metric we haven’t yet explored is the number of channels an account engages with prior to purchase. This metric is particularly valuable to understanding the multi-channel nature of the B2B customer journey.
Our data shows that the average B2B customer journey touches 3.1 different channels before closing.
From this, we find that the number of channels accounts touch before closing differs only slightly. Meaning that there are no major outliers to the data.
But there is some interesting variance when it comes to the first-touch channel. Our data shows that while Paid first touch falls broadly within the average, when Social and Review sites are the first touch, the account will go on to engage with +1 more channels in the journey.

We hope you’ve enjoyed the insights of this first B2B go-to-market benchmarks report.
If you have suggestions for additional benchmarks you’d like to see, we’d love to hear them. So please reach out.