
A year in review: highlights of Dreamdata’s product development
For the product team at Dreamdata, it’s easy to get lost in the day-to-day; developing, building, updating and improving our brilliant product. And while, as our CTO Ole Dallerup often reminds the team, “more can be done”, it’s worth taking a step back and reflecting on just how much has been done over the last 12 months.
So in this post, we’ll be summarising the most notable product updates of the last year.
Go-to-market data platform ✅
Around this time last year, the team opened up Dreamdata’s data models. This enabled customers to create their own dashboards, reports, insights and automation in their favourite tools.

The go-to-market data-platform collects, transforms and models all recordable go-to-market data, acting as a single source of truth to be activated in-app or in 3rd party destinations.
You can find 10 use cases for the data platform in this article. And details on how to activate your data here.
See the Integrations and Destinations below 👇
Single sign-on ✅
Signing in to the Dreamdata app became much easier with Google and Microsoft single sign-on being made available.

Integrations and Destinations ✅
Whether it’s more from the marketing tech stack, Marketo, or on the tracking side of things like Zapier, Dreamdata has grown the integrations and destinations.
Apart from BigQuery, customers can now have their data stored in Snowflake and Amazon Redshift
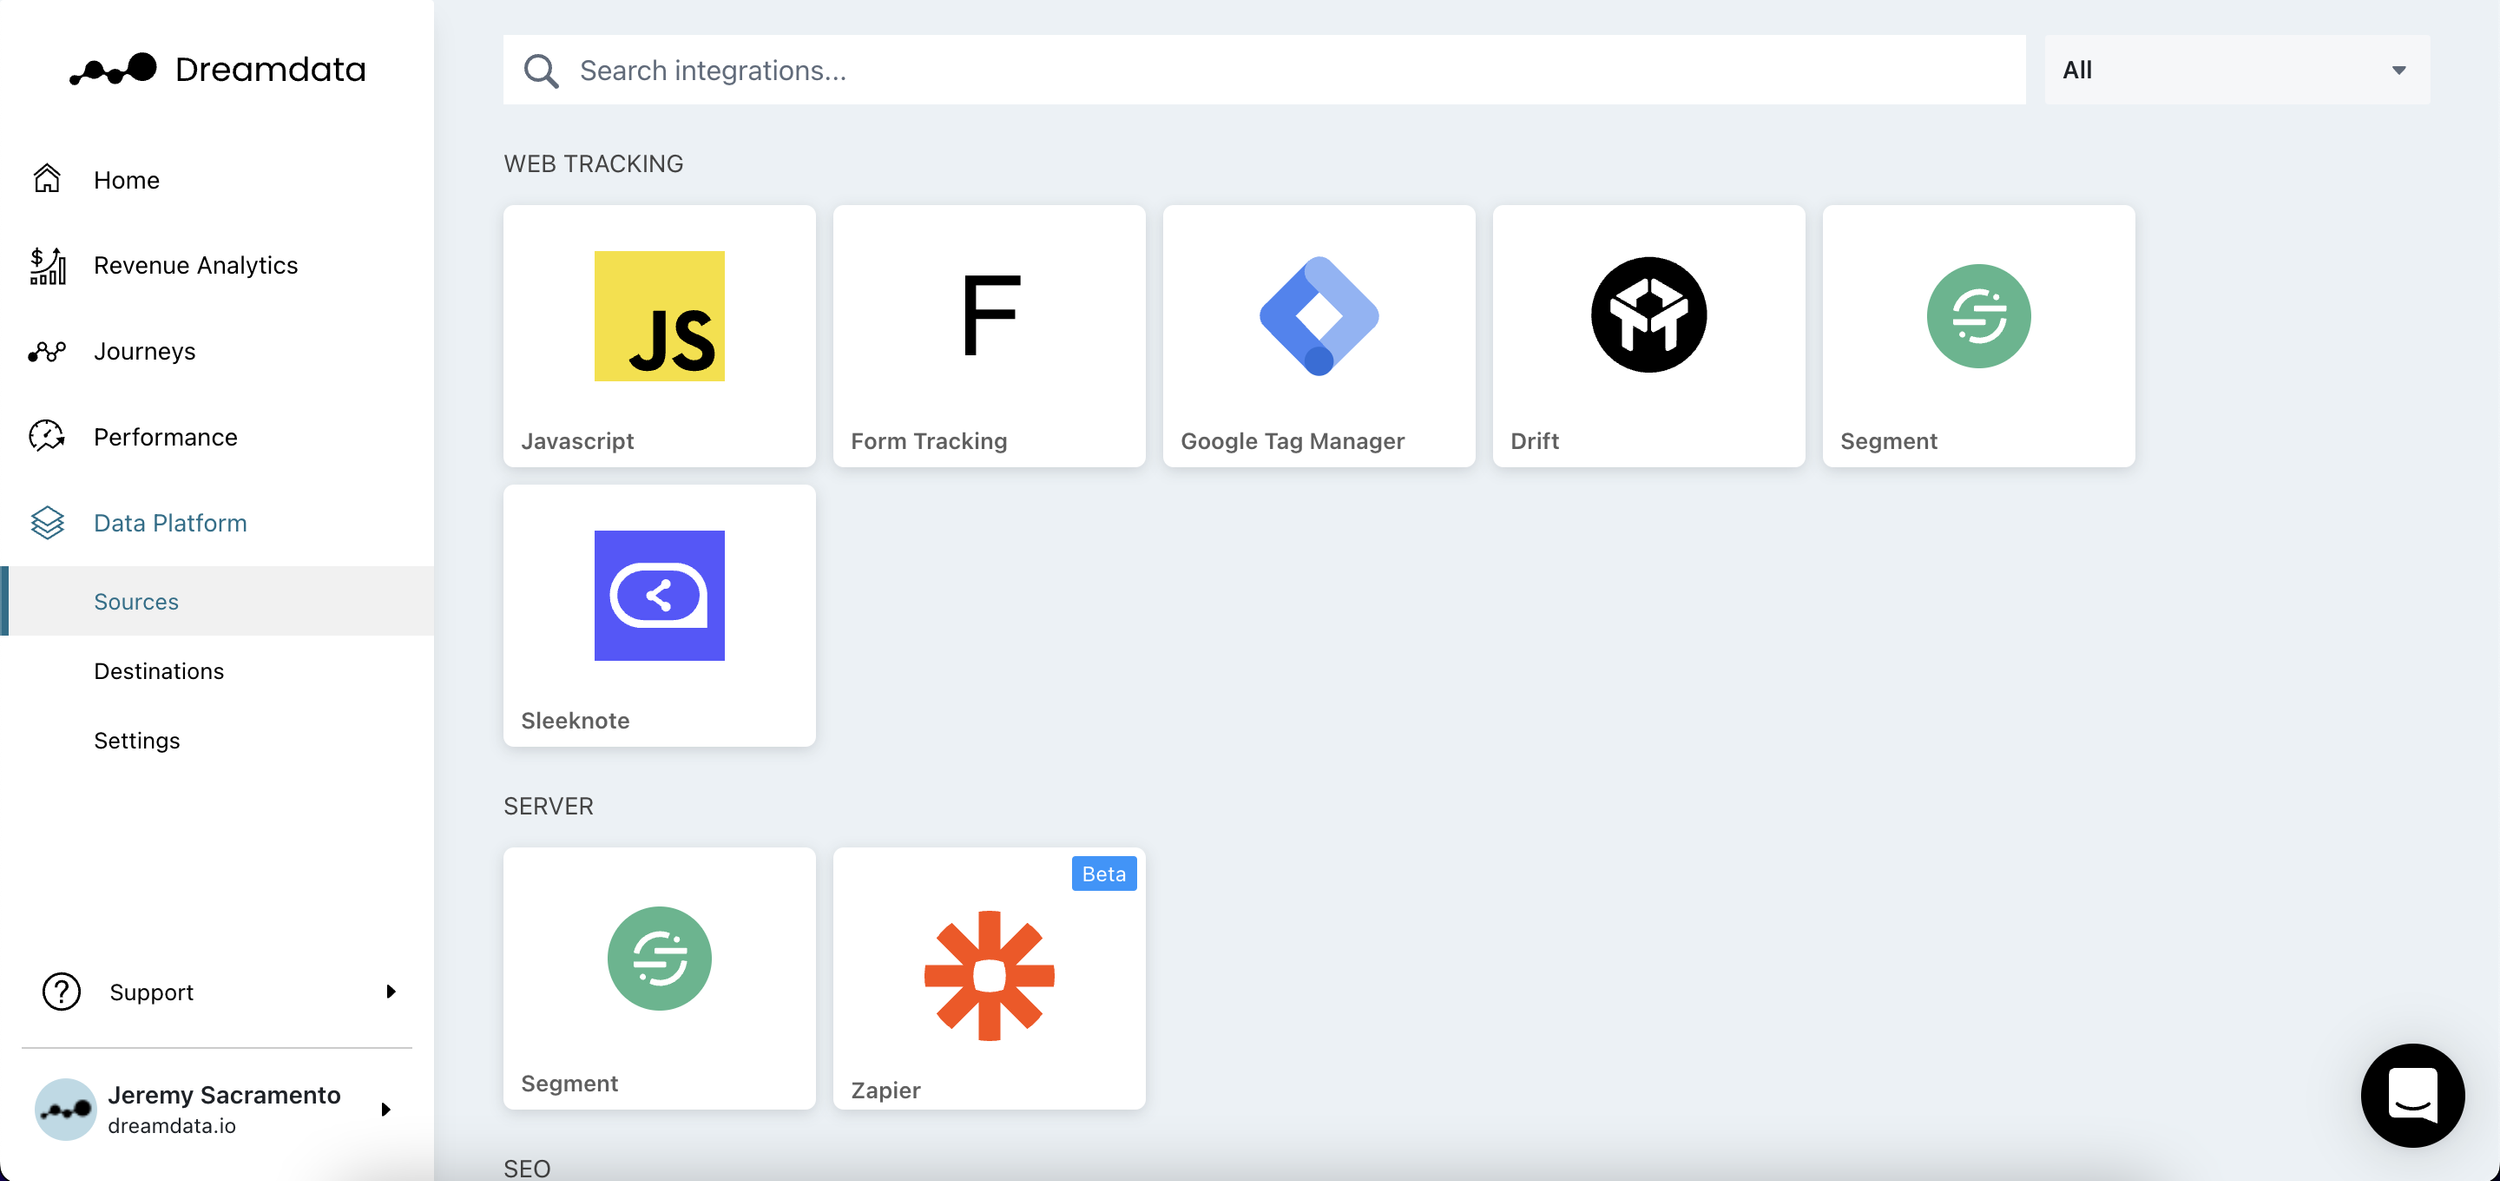
You can check out the full list of our current integrations and destinations here →
Features and dashboards ✅
The most significant updates have no doubt been the new features and dashboards releases. These have expanded the app’s utility across a range of use cases, such as content marketing - with our groundbreaking Content Analytics - performance marketing, and site analytics.
Content Analytics
The double-dashboard Content Analytics feature is the highlight of the last few months. But I would say that as a content marketer wouldn’t I?
The Content Analytics and Content Performance dashboards are a first of their kind

You can read much more about the new dashboards here and about how you can fire up your content with them, here.
Google Search Ads, Display Ads and Youtube
Dreamdata users were given separate Google Search, Google Display and Youtube Ads dashboards, each with a number of new and updated reports including Keyword, Bid Goals, Audience and Geo performance reports.
With this new setup, Dreamdata users are now better able to break down their Google Ads efforts and track all the relevant metrics per channel to see exactly how and why campaigns are working or not.
You can read more about these dashboards here.
G2 Dashboard
G2 users were treated to a dedicated G2 dashboard, where they could integrate their business intent reports with Dreamdata. This enables users to not only see and act on G2’s intent data but also attribute revenue and pipeline generated to the touches.

You can get all the details on what’s in the dashboard and how you can use it to great effect in this post.
Real-time dashboard
The Real-time view dashboard shares real-time data on what’s happening on your site right now.
This enables users not only to visualise traffic and their behaviour but in so doing, help monitor the immediate impact of new campaigns or announcements. It also includes seeing if there are identified users browsing the site.
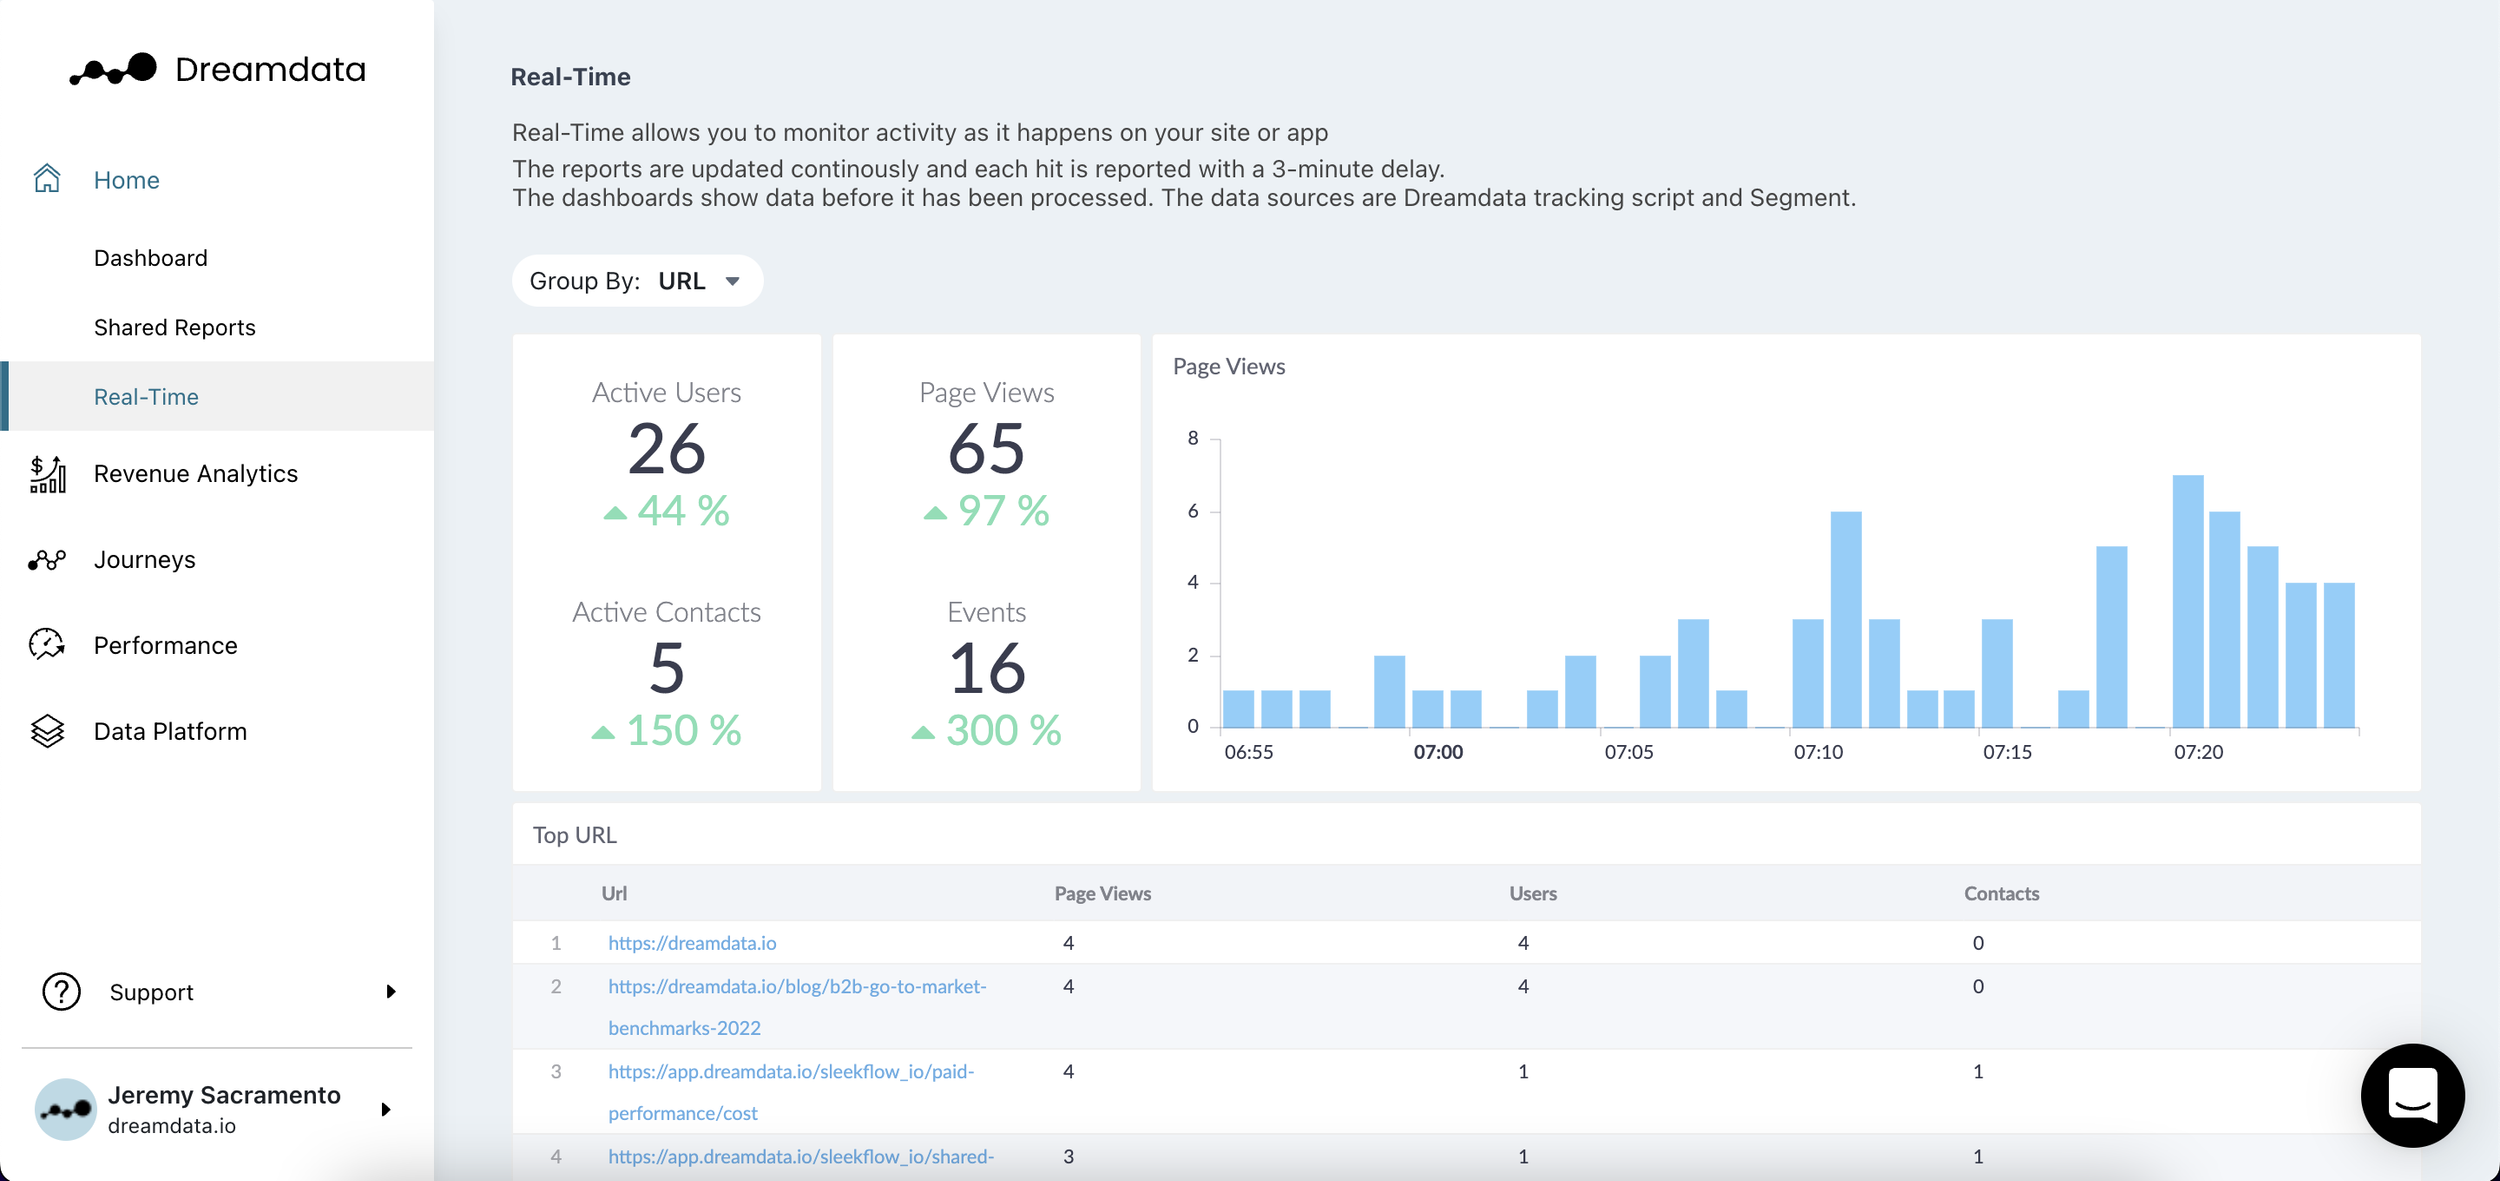
You can read more about the new feature in this post.
Shared reports
The Shared Reports menu is where you (and your teammates) can find all the reports you’ve saved.
All your saved reports will appear on your Shared Reports menu, where you’ll be able to give the report a relevant title and description.
These are then available to all team members by default. But if there’s anything you don’t want to share, you can apply all the standard restrictions.

Home page overhaul
The product’s homepage was also overhauled to better visualise your growth over time, we’ve added a customised usage and growth chart from your sources as well as the various data sources the customer has integrated and show the date and time of the latest data synchronisation.

Account owner filter
A subtle, but hugely important addition was the ‘Account Owner’ feature. This filter, along with the inter-report linking (covered below) was part of the push to improve the Sales and BDR.
By quickly filtering accounts under an AE’s name, they’re better able to investigate exactly what the account has been up to; going a long way in improving nurturing, activation and performance measurement.

You can read more about how Dreamdata helps Sales teams close more deals here.
Data-driven attribution
Although going through beta testing as this post goes live, the product team has now completed the new data-driven attribution model.
This model applies machine learning and AI to assign credit based on data. In other words, users do not have to play around with say Linear or U-shaped multi-touch models but simply let their own customer journey data speak for itself.
UX and UI ✅
Of course, Dreamdata users who have been on the platform over the last year will have noticed the incremental improvements to user experience and interface.
In terms of UI, the platform has now been aligned with the Dreamdata brand and has had most visuals enhanced to facilitate analysis.On the UX side of things there have been four noteworthy changes:
Relative dates
Dreamdata now supports relative date ranges in the Date selector, e.g. Last 28 days, Last month, Last quarter.
This means that customers can now create and share advanced core reports like quarterly reports or month/year-end reports: making report generation simpler and faster.

Filters
Over the course of the last 6 months, a large number of filters have been added across dashboards. The filter functionality was also overhauled to have ‘dynamic’ and ‘sticky’ filters, allowing users to have relevant filters for each dashboard and to keep their filters fixed across the application.
This has made digging deeper into the analytics easier and faster.
Inter-report linking
Most reports have now been interlinked with Journeys, making it easier for users to identify who and from what account has engaged with the brand - this is particularly useful for ABM and Sales/BDR work.

Navigation menu
A worthy mention needs to be made about the updated navigation menu, which is now consolidated into four tabs - Revenue Analytics, Journeys, Performance and Data Platform - to offer a sleek and intuitive experience.
Documentation ✅
Also, an honorary mention needs to be given to the ever-growing, ever-fresh product documentation, without which customers and their teams wouldn’t be able to navigate (and expand) their use of Dreamdata easily.
