
Your favourite Dreamdata reports 2023

The numbers are in! Here’s our annual rundown of Dreamdata’s most-used reports!
While our product team has continued pumping out product releases and updates, you, our users, have been busy using them to drive your go-to-market performance to new heights.
So let’s take a look at what B2B marketers across the world have been working hard to achieve with Dreamdata this last year.
Of the over 40 reports available on Dreamdata, these are the top 5 by number of (unique) views. 👇
Note: this data is derived from Dreamdata users of all our plans (including Free), which means there is a slight skew towards the reports available on all plans - see our new free offering here →
(Bonus) Reveal Report
Although it just missed out on making this year’s top 5, our Reveal report deserves an honorary mention.

Dreamdata Reveal was only launched in September 2023, despite this, the report has accumulated a sizable portion of our platform’s unique visits… and I’m going to go out on a limb here and predict that Reveal will be within the top three reports (comfortably) by the end of next year.
With Reveal you get instant access to a list of every account engaging with your brand across platforms, helping you never miss sales-ready accounts on your doorstep.
We can do this by collecting engagement signals from several high-intent sources, including LinkedIn Ads engagement, G2, and your website. And, by integrating with your CRM, Dreamdata can also tell you whether the engaged accounts are already on your CRM or not.
Common use cases:
Are there any ICPs engaging with our brand who are not in the CRM?
Are there active companies with no assigned account owner?
Are any of the active companies visiting our pricing page?
Which opportunities in our sales pipeline are most active?
Have any closed-lost deals become (re)engaged?
See Reveal in action in this video —>
5. Content Performance
In 5th place is the Content Performance report, where customers come to see the effectiveness of their content efforts.

The Content Performance report answers the questions: “How is my content performing?” and “Is there scope to optimise and improve performance?”
Customers are able to deep-dive into who exactly is viewing which content, at both account and user level. Enabling them to tailor content to the right audience, at the right time.
Common use cases:
What content is influencing pipeline and revenue?
Test the content funnel.
Compare content category performance.
Identify what channels work best for different content.
Content Segmentation by role, industry, deal size, company size etc.
Product-led growth, product analytics, and product-qualified leads
See Content Performance in action in this video —>
4. Acquisition Report
At number four was the Acquisition report.

The report, available on our paid plans (Team, Business and Enterprise), is the home of go-to-market performance metrics.
It offers a great overview of acquisition channels cross-compare the performance of channels and campaigns against leads, opportunities, deals and revenue generated.
With these insights, most customers then springboard to the individual channel performance reports such as Google Ads, Capterra, or Contentfor more granular analyses.
Common use cases:
How many SQLs did my best Google campaigns generate vs my Capterra ads?
How did my newly launched campaign perform over the last quarter compared to my all-time best-performing campaign?
Did my Product Hunt launch generate any business value?
3. Digital Analytics Reports (Pages, Events, Real-time)
In at number three is the Digital Analytics suite.
In fact, three reports from our Digital Analytics package made it into the top 5, separately: Pages, Events, and Real-time reports. But we’ve bundled them together for ease of reference.
Pages Report
The Pages report puts the focus on the performance of each individual URL. How much traffic does each page generate? What are visitors doing? Are they converting? Are they hanging around for a while? Where are they coming from?
With our updated Free plan, you can dig deeper into these metrics with our to see whether pages are impacting your pipeline KPIs.
Events Report

The Events Report provides insights into all tracked ‘events’ (touchpoints, e.g. page view or form submission).
With Events customers can segment each page by Channel, Source, Campaign, Referrer etc. to gain insight into the channels that people use to arrive at a specific page.
Common use cases:
How many people downloaded our ebook last month?
How many of the companies that downloaded the ebook turned into pipeline?
What is the top Channel acquiring contacts who ‘book a demo’?
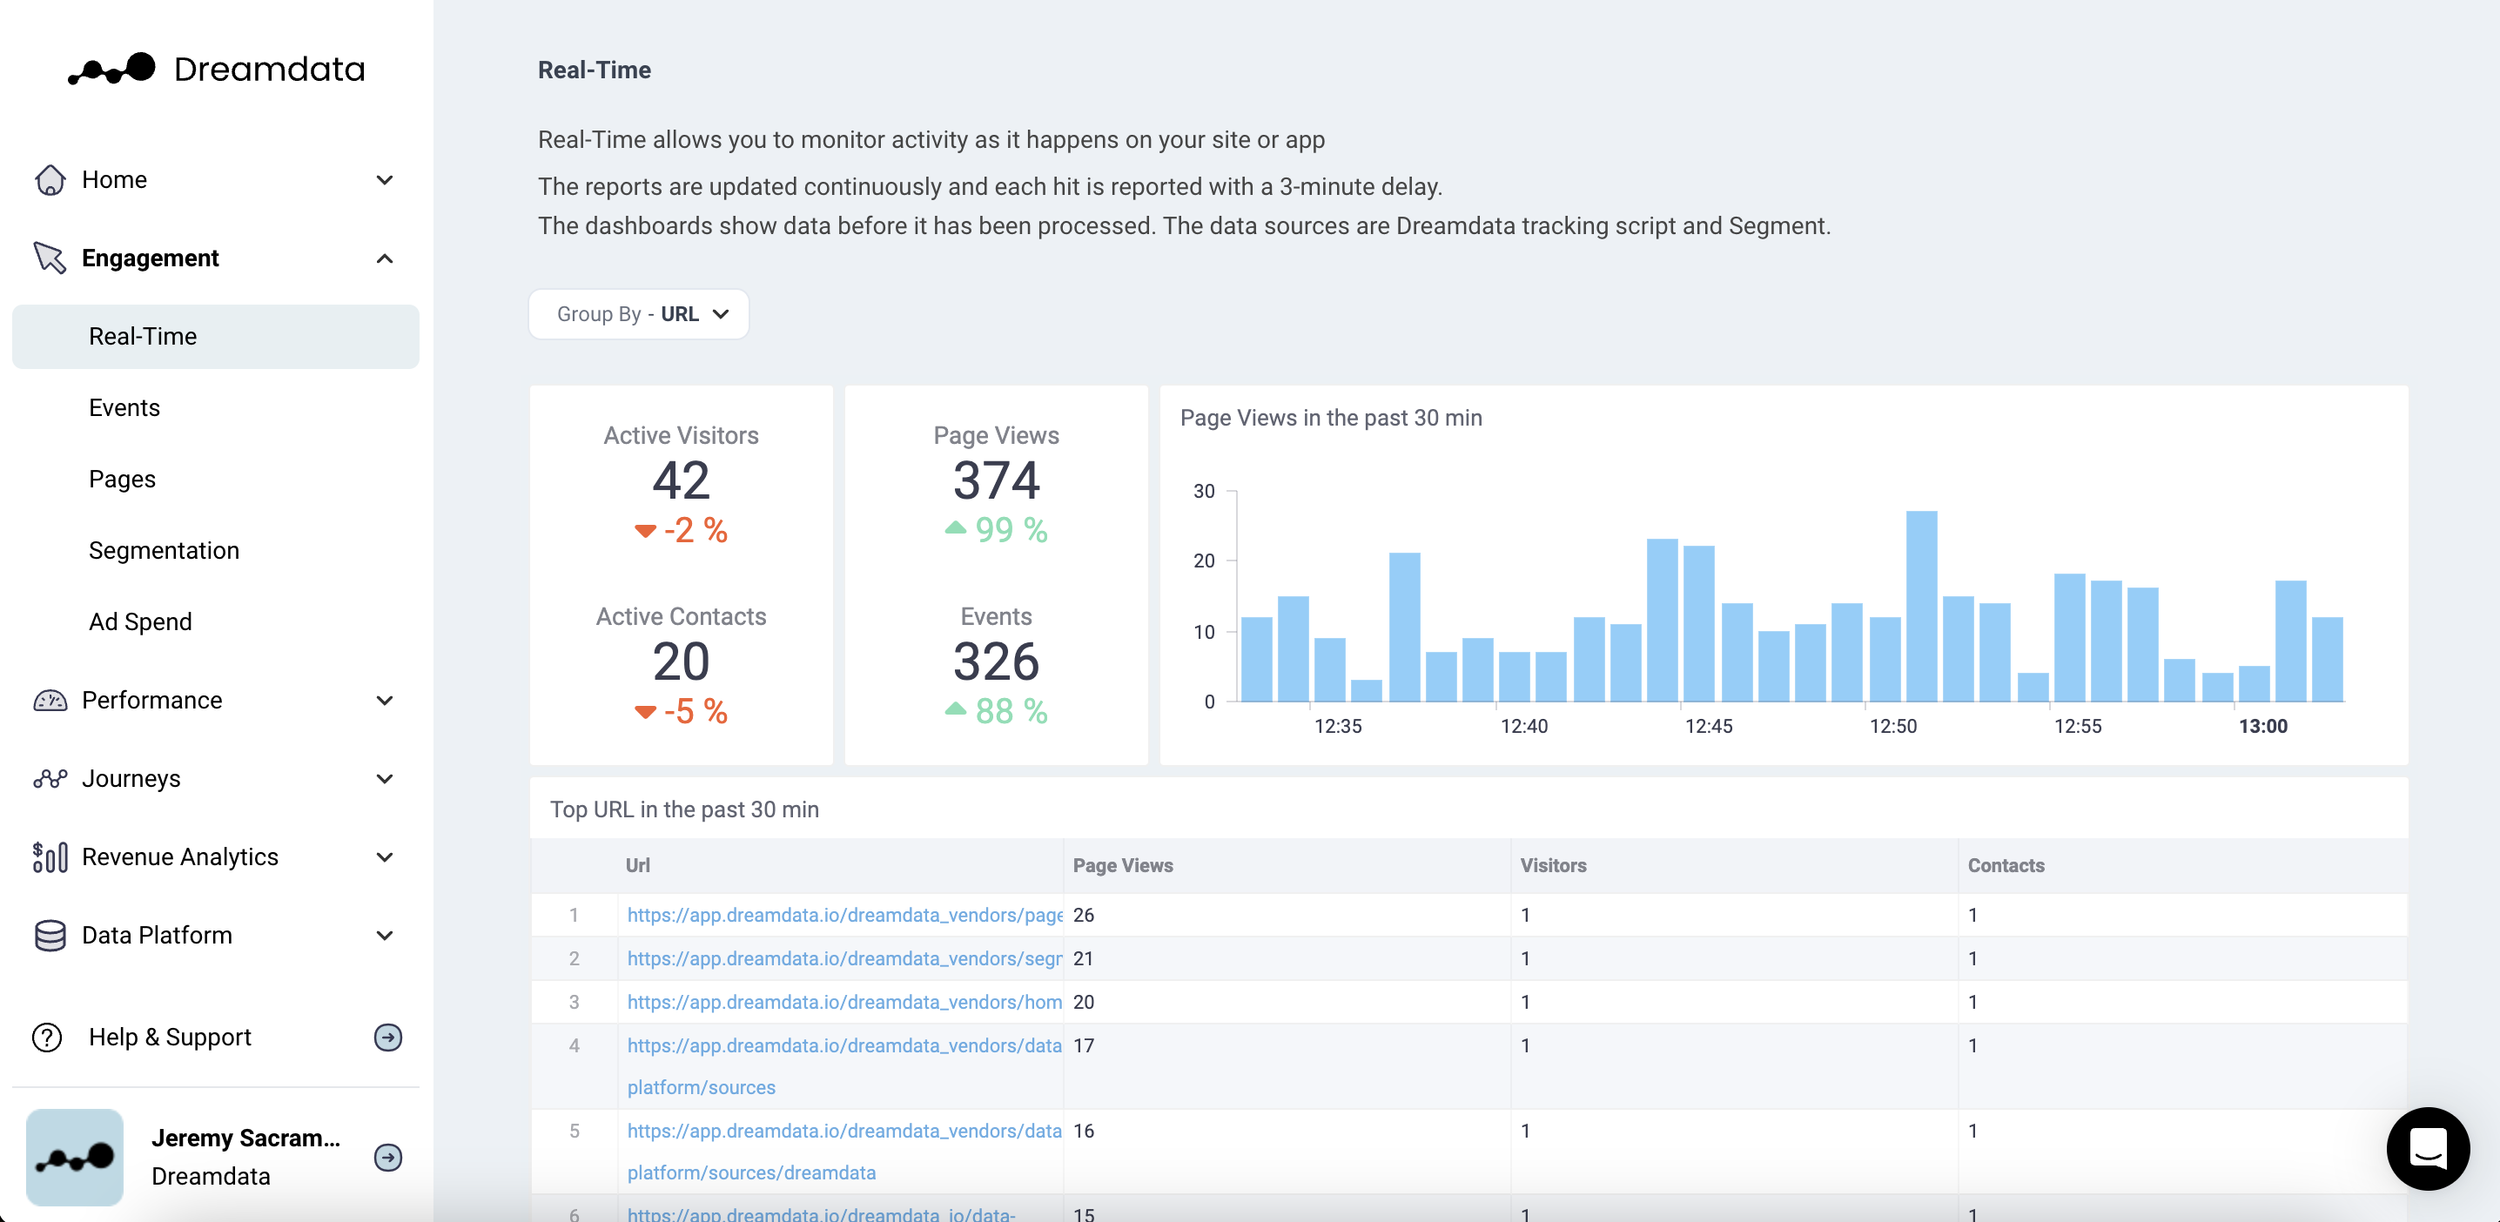
Real-time view dashboard.
The Real-time report monitors on-site activity.
Over the year, it’s been used by Dreamdata users to track the immediate impact of new ads campaigns, company announcements, and LinkedIn posts. With the ‘campaign’ and ‘source’ filters being the most popular.
2. Revenue Attribution Report
In second place was the Revenue Attribution dashboard, where Dreamdata users have been heading to find the sources of their revenue.

This dashboard, we show the process of connecting B2B go-to-market efforts with revenue and pipeline generated. Which has allowed Dreamdata users to analyse the business value of their channels.
Common use cases
What channels were responsible for the most leads, opps, and deals over the period?
How big was the impact of paid marketing on the deals we won last quarter?
How many opps did the Newsletter generate last year?
What campaign started the most journeys last quarter?
1. Journeys Report 🥇
Up top were our Customer Journey reports.
This not only reaffirms the value of Dreamdata’s B2B customer journey mapping but highlights the need B2B go-to-market teams have for account-level journey insights.

With the Customer Journey insights, users have been able to deep dive into the nature of their customer journeys, including their activity level, and how this changes depending on the Channels and Campaigns.
Dreamdata customers on the Team, Business and Enterprise plans have made just as significant use of the more detailed customer journey map.

A final word
To wrap up, our customer’s usage of Dreamdata over 2023 has shown us just how much B2B marketers are getting out of our reports and features.
From the newly launched Reveal report to the highly used Customer Journey reports, Dreamdata is playing a big role in shaping marketing strategies across the B2B space.
It also shows us the breadth of the platform, with B2B marketers using Dreamdata for the full range of use cases, from figuring out how well content is doing to understanding what sources are behind revenue.
Looking to next year, as more people start using features like the Reveal report, (and yet-to-be-launched features - watch this space) we’re likely to see even more growth and success for B2B go-to-market teams using Dreamdata - you can catch some great success stories here.
Where will Dreamdata take you?