
How to analyse Google Search Ads with Dreamdata

This article outlines how Dreamdata coupled with detailed knowledge of your Google Ads Account’s hierarchy can be leveraged to boost performance and ROAS.
Brief intro to analysing Google Search Ads with Dreamdata
For the performance marketer, the biggest driver behind purchasing an attribution tool like Dreamdata is identifying (and boosting) the ROAS of their paid ads channels.
Yet a positive ROAS on your Google Ads account isn’t always a sign that things are running as well as they could be.
What about when that request to 2x (quality) leads comes in? Scaling by throwing cash into everything you’re running might work, but chances are that hidden in the mix are pretty poor performers, or campaigns which are ‘maxed out’.
Any success in boosting ROAS rests on scrapping the poor performers and scaling what works.
In this post we’re going to cover the basics of repeating successful efforts, identifying those with potential and scaling the top performers using Dreamdata (and a detailed knowledge of how your Google Ads are set up).
Google Ads account Structure
Let’s start with a quick review of your Google Ads account structure. If you are already familiar with Google Ads Account structure, you might want to skip this part and jump right into the analysis section.
In the image below you can see the layers that your account consists of.

The structure is as follows: each Campaign that you run via Google Ad Network has a number of Ad Groups which themselves consist of selected Keywords and Ad Copies.
With this hierarchy in mind, let's break down the structure of Campaigns, Ad Groups and Keywords in more depth.
Campaign Level
The Campaign is the foundation of your account. It starts with choosing the campaign type and all other necessary settings like: language, target area, budget, etc.
Ad Group Level
The first level below the campaigns is ad groups. Ad groups main purpose is to create structure within each campaign, therefore they are organized by themes. An ad group contains associated keywords, bids and one or more ads.
Keywords
The next level consists of the selected keywords you’ll bid on for each ad group. Keywords give the control of your spending, you can choose how much you're willing to pay for a click on a specific keyword.
Ad copy
The final level in the Google Ads Account hierarchy is Ad Copy. This is the final visual promotion of your brand/product/service for your prospects. This level allows you to run different Ad copies which are then effectively A/B tested.
Analysis
Let’s now go through the steps you need to take to analyse your Google Ads’ performance using Dreamdata.
If you’re interested in how Dreamdata connects your Google (GCLID) data to revenue, check out this post.

What is your ‘Time-to-Value’ metric?
Before digging into the adds themselves, you need to make sure you know your Time to Value.
This metric allows you to know how long it takes for your paid channel to generate pipeline (e,g MQL, SQL) and revenue.
Without knowing this metric it’s next to impossible to determine when the right time to make the final conclusions about your paid marketing efforts actually is.
For instance, say it takes 3 months for a customer to go from first-touch to purchase. If you’re assessing the impact of a campaign after just one month, you’re going to arrive at erroneous conclusions about the campaign’s performance.
By connecting your Google Ads data to pipeline and revenue, Dreamdata tracks this metric. You can find your Time to Value under the Revenue Analytics → Revenue Segmentation.
Select the date parameters, your preferred stage model (i.e. what pipeline stage you’re measuring against), then group the data by First Touch Channel.

After filtering the data scroll down to the Performance by First Touch Channel table. In this table, each marketing metric is based on a certain number of prospects/deals that are in your CRM pipeline.
Bear in mind, 1) that the sample of prospects/deals is large enough to offer validity, and 2) that the data is accurate - especially if you’re early in your Dreamdata journey (click on the Leads link to see that these match what’s in your CRM).

You can then identify the Avg Days to Value metric. Use this metric as an indicator for understanding which time period you should set when analysing your Ads performance.
In the shown example, where we’re looking at the time from Paid frist-touch to sign-up, we need to wait at least 11 days before we dive into the analysis.
You can learn more about the importance of the time-to-value metric in this post.
Analysing your Google Ads: the filters
Going back to the Google Search Ads Dashboard:
Performance → Paid → Google Search Ads

In this dashboard, you will find all the information you need to understand how your Google Search and Smart Ads are performing.
Our Group By filter will allow you to break down your Google Search Ads account hierarchy and perform an in-depth analysis on each level.
Let's start with addressing the filters for the analysis.

Date: Set the time period which encompasses the Time to Value metric we discussed above.
Also, for better results, we advise to set a date period no later than when you introduced your Dreamdata tracking on your website.
Stage Model: Select your preferred stage model. Your (pipeline) stage model is the goal you’re measuring against. When setting up Dreamdata you’ll have the opportunity to define your own pipeline stages. Returning to our analysis, we’re using ‘sign-up’ (to the Dreamdata app) as the stage model. We consider this to be ‘qualified’ enough for the purpose of testing .
But you’re not limited to this. If you want to assess how effective your ads are in pulling ‘closed deals’, you can set your modelling accordingly. In fact, you’re probably going to want to be using more than one model at a time.
Attribution Model: Select your preferred attribution model. When analysing the impact of your Google Ads, the two most commonly used attribution models are first touch and last touch.
But in reality, choosing the model is highly dependent on what your business objectives are, your role and indeed the role of your team. We recommend discussing attribution models to use internally with your team - our support team is also available for advice should you want. You can read more about Attribution models in this post.
Campaigns: To get a full understanding of the performance we set the campaigns filter as All.
Ad Groups: Once again, to understand overall Ad Groups performance we set the filter as All.
Group By: This filter should be adjusted depending on the Google Search Ad account level you are analysing.
Note: These are just some tips on how to set your filters, each business case is different and you should select these filters based on your needs.
Analysing your Google Ads: the analysis
We would recommend starting with tackling your Google Ads Account from top to bottom. I.e. Campaign → Ad Group → Keywords
Our first task is to split each of the hierarchy levels into:
Positive: Campaigns/Ad Groups/Keywords that have produced Prospect or Deals
Negative: Campaigns/Ad Groups/Keywords that have not produced Prospect or Deals
To do that you need to scroll down to the Performance table.

In this table, we list all the Search and Smart Campaigns and Ad Groups in Google Ads that were running during the set time frame.
Dreamdata then provides all the metrics for each campaign making it easier for you to run the analysis.
To help isolate campaigns, we would recommend exporting this data into a spreadsheet tool such as Google Sheets.
To do so, click on the settings icon in the upper right corner and download the data in CSV or Excel format.
1. Positive campaigns
Once you’ve exported the data into your preferred tool, you are ready to separate these campaigns. First split them up into positive and negative campaigns. As mentioned above, positive campaigns are those that produced Prospects or Deals.
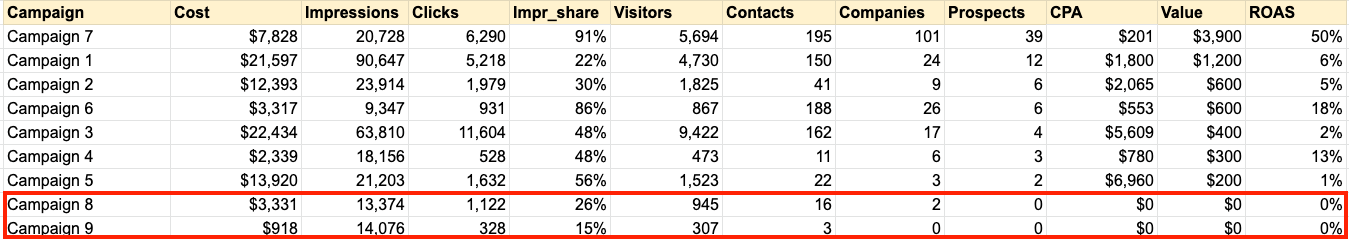
In this example, we see that Campaigns 8 and 9 have generated no sign-ups and should probably be scrapped.
2. Negative campaigns
This initial analysis is also an opportunity to learn about what’s working and what isn’t, and so what you should avoid doing in the future. That is, what about Campaigns 8 and 9 are not making them drive the right traffic? If you can identify the cause, e.g. keywords, bidding strategy, copy, etc. you can take note and make sure to avoid these (costly) efforts in the future.
3. Search impression share
Once you’ve identified the positive campaigns (the good performers), you can move on to identify which of those campaigns have untapped potential. In other words, those campaigns that you can squeeze more juice out of.
For this we use the Search Impression Share metric, which indicates the scope for scaling impressions by purchasing more of that traffic.
At Dreamdata we have a predefined criteria for Campaigns with untapped potential of 70%. I.e. All campaigns that contain an impression share below 70% are considered as high potential campaigns.

To help spot those with the greatest potential we apply some conditional formatting to the Impression Share column - green good, red bad. Those with the highest share can be excluded from our list of ‘scalable ads’.
This doesn’t mean shutting down these campaigns, much the opposite, it means keeping them if they’re performing well - like our Campaign 6 in the example - but not spend more $ buying that traffic.
3. CPA
The final step is to break down untapped potential campaigns into: Campaigns that are within your target CPA and Campaigns that are out of your target CPA.
A quick word on about the CPA metric. Cost per acquisition metric gives you an estimate of the costs you’ve paid to get a single prospect/customer down the funnel.
CPA along with other metrics like average value per prospect/customer, ROAS plays an important role when getting a full picture of your paid marketing success.
The relationship of these metrics will help to justify lead/deal generation costs and define your target CPA.
This simple action will allow you to pick campaigns that you are willing to (re-)invest in. The final list will contain the positive campaigns that have both untapped potential and meet your CPA criteria.

So, in our example case, it’s Campaign 1, 2 and 4 that we’d select as our target scalable campaigns.
To ensure a holistic analysis of your Google Ads, this same analysis should then be applied to each level of the hierarchy - ad groups and ads.
To do that, you just need to change the filter by the specific campaigns and ad groups, and follow the exact the same steps as above.
Conclusion
When you’ve connected your Google Ads to pipeline and revenue with an attribution tool like Dreamdata, you gain more than just an accurate ROAS. You’re also able to identify how to scale your paid activities for growth. 🚀
Our analysis above has shown how in 4 simple steps (repeated for each level of the hierarchy) you can optimise your Google Ads efforts.

Ready to scale your ads?
Start with Dreamdata Free today