
Product update - shared reports and Real-time view are now live!

True to form, our product team has been very busy this month with releases to treat all the data dreamers out there.
After the successful release of our Content Analytics product, the Dreamdata app has this week been further updated with two new features:
- Shared Reports
- Real-time view dashboards
- (and a change to the app home screen 👀)
Let’s give you a quick intro to the new stuff!
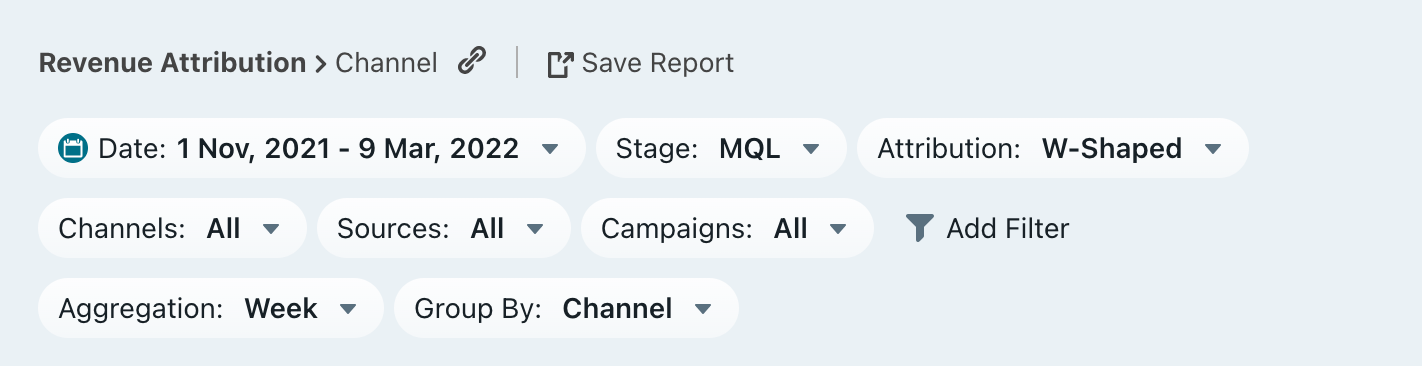
Shared Reports - instant access to what matters most

First up is the Shared Reports menu, which you’ll find under “Home”.
The Shared Reports menu is where you (and your teammates) can find all the reports you’ve saved.
Wait a minute, you can save reports now?
Oh yes, forgot to mention that as part of this report sharing functionality, you can now save any analytics you’ve run and would like to keep for posterity. The prime suspects are weekly, monthly and/or quarterly reports.
All your saved reports will appear on your Shared Reports menu, where you’ll be able to give the report a relevant title and description.
Saved reports will be available to all your team members by default. But if there’s anything you don’t want to share, you can apply all the standard restrictions.
Thinking of running a similar report in the future? Don’t bother re-doing all the analysis from scratch. With Shared Reports all you’ve now got to do is use an existing report as a template and all you’ve got to do is update the dates and slap on a new title.
So whether you’re a Dreamdata pro wanting to compile (and save) dozens of your favourite analyses, or a Dreamdata newbie looking to set up something that you can wrap your head around, Shared Reports is the thing for you!
Find out more about how to navigate the dashboard in our documentation.
Real-time view dashboard - keep an eye on what’s happening right now

Next up is the Real-time view dashboard which will dazzle you with real-time info on what’s happening on your site right now.
In the Real-time dashboard, which you’ll also find under ‘Home’ on the navigation bar, you can monitor activity on your site.
Set up a new ads campaign? Made an exciting announcement? Put together a viral post on LinkedIn? Witness the increased activity in real-time.
But wait, that’s not ‘it’. Not only can you monitor active users, but you can also see if any of those are active contacts (identified users). You’ll also be able to filter by Source, Medium and Campaign and see whether any events (sign-ups) are taking place.

The Real-time dashboard will also serve as the first port of call for troubleshooting the tracking script. If there’s no activity on any pages for a prolonged period of time, chances are that the script’s not working.
Check out the details in our documentation.
Newlook Home Dashboard
Finally, you may have noticed that the Home page has been given a makeover too.
We’ve done away with the report map and introduced a new dashboard highlighting some facts about your account.
To help visualise your growth over time, we’ve added a customised usage and growth chart from your sources as well as some useful quick links.

(demo preview)
Hope you enjoy! And as always, please do let us know what you think and pass along any feedback!
Not already on Dreamdata?
Start free today!