Your favourite Dreamdata dashboards and attribution models 2022
Here’s the rundown of Dreamdata’s most-used reports and attribution models this year!
While our team’s been busy pumping out product releases and updates, our users have been busy using them to propel their go-to-market and improve performance.
So let’s take a look at what B2B marketers across the world have been working hard to achieve with Dreamdata this last year.
Of the approximately 40 reports available on Dreamdata, these are the top 5 by the number of (unique) views. 👇
Jump to the top 5 attribution models →
5. Acquisition Dashboard
At number five was Acquisition with 6.2% of unique views.
This dashboard, available to Team and Business customers, is the home of go-to-market performance metrics.
It has been used to cross-compare the performance of channels and campaigns against leads, opportunities, deals and revenue generated.
Our users were finding answers to:
How many SQLs did my best Google campaigns generate vs my Capterra ads?
How did my newly launched campaign perform over the last quarter compared to my all-time best-performing campaign?
Did my Product Hunt launch generate any business value?
The Dashboard offers a great overview of acquisition channels and is most often used as a springboard for a more granular analysis on the individual channel performance dashboards such as Google Ads, Capterra, or Content.
4. Events Dashboard
In fourth place is Events - one of the Digital Analytics (Free tier) dashboards.
The Events dashboard is the blank canvas reporting tool of the Digital Analytics product - which is why it’s no surprise to see it feature at number 4, with 6.4% of the total unique views.
Since its release, it has been used to analyse all the touchpoints (events) taking place on users' websites, and from this answer questions such as:
How many Free-sign ups have there been?
What source channels are behind my best-performing conversions?
How many visitors, contacts (identified visitors) and companies (identified accounts) have there been over the last quarter?
How many of them booked a demo?
Not using the Events dashboard? Get a detailed intro in this vid 👇
Not using Dreamdata? Events is available for Free, get started today!
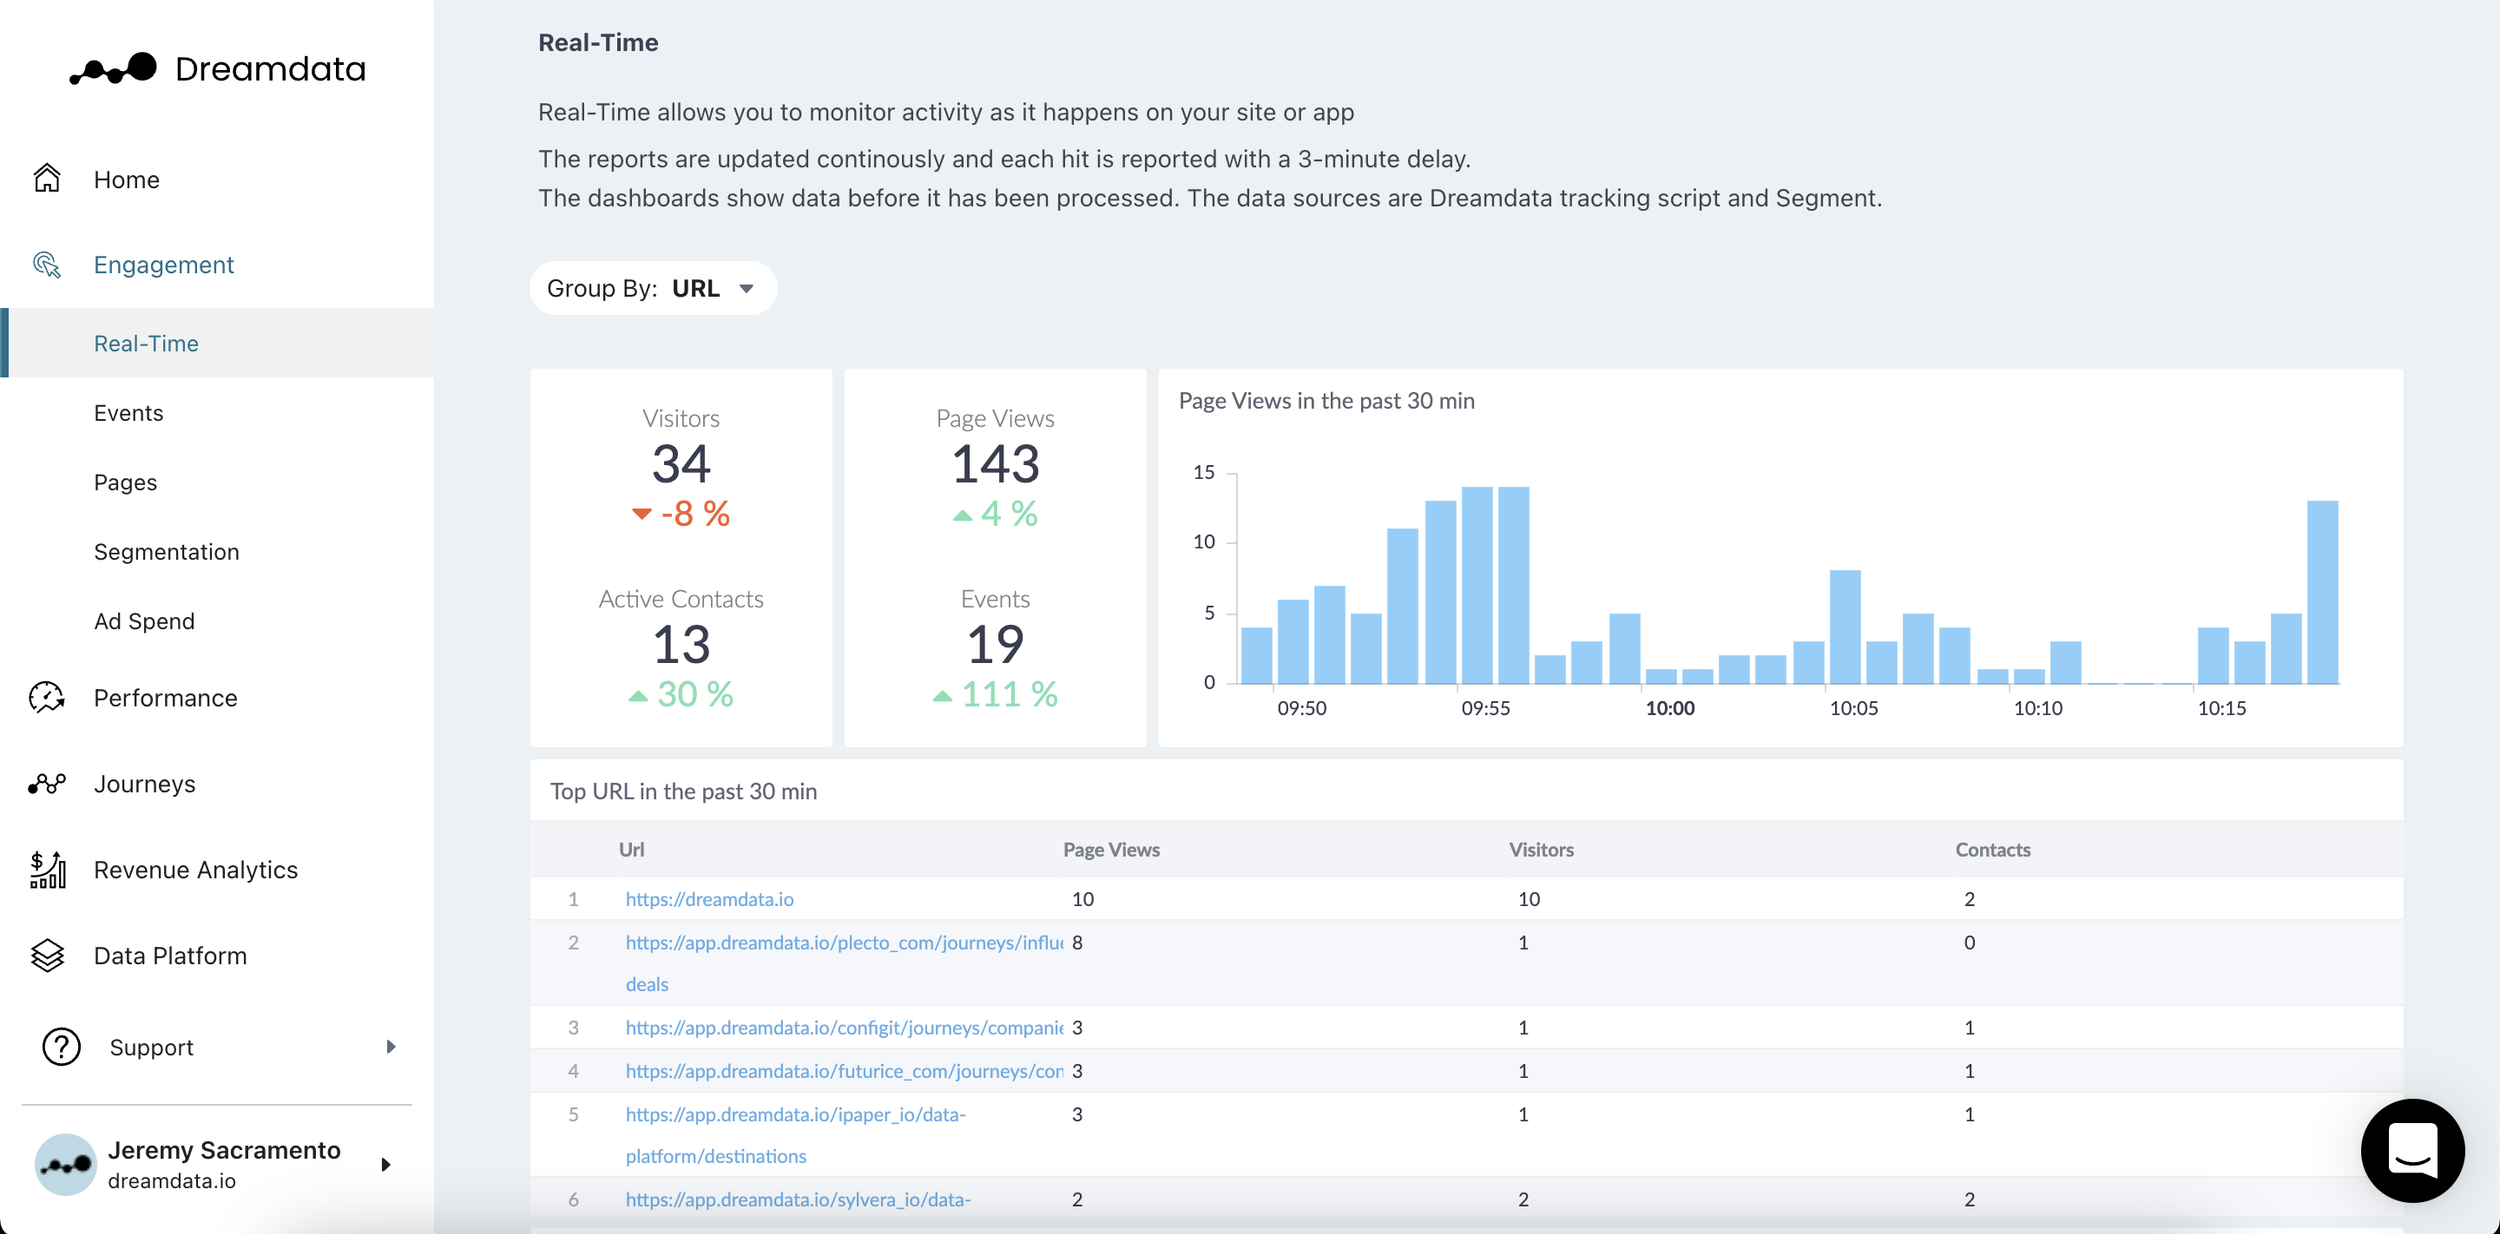
3. Real-time Dashboard
In number three was the Real-time view dashboard.
The Real-time dashboard, which is also part of our Digital Analytics (Free) package, monitors on-site activity.
Over the year, it’s been used by Dreamdata users to track the immediate impact of new ads campaign, company announcements, and LinkedIn posts. With the ‘campaign’ and ‘source’ filters being the most popular.
2. Revenue Attribution Dashboard
In second place was the Revenue Attribution dashboard, where Dreamdata users have been heading to find the sources of their revenue.
The dashboard is the result of Dreamdata connecting B2B go-to market efforts with revenue and pipeline generated. This has allowed Dreamdata users to analyse and visualise the business value of their channels, and see what’s worked and what hasn’t.
1. Journeys Dashboard 🥇
Up top, with a whopping 21% of unique views was our Customer Journey (companies) dashboard.
This not only reaffirms the value of Dreamdata’s B2B customer journey mapping but highlights the need B2B go-to-market teams have for account-level journey insights.
With the Customer Journey insights, users have been able to deep dive into the nature of their customer journeys, including their activity level, and how this changes depending on the Channels and Campaigns.
Dreamdata customers on the Team and Business plans have made just as significant use of the more detailed customer journey map.
If you’re curious about what report didn’t make the cut, here’s a wider overview of the Dreamdata dashboards by unique views in 2022.
The Top 5 attribution models
On the attribution model side of things, the top five models of choice over 2022 were 👇
5. Last-touch attribution model
Over the year only 3.9% of users have run their reports with the last-touch attribution model.
4. Data-driven attribution model
Our data-driven attribution, launched earlier this year, came in as the fourth most-used model, with 13.8% of users running reports with the model.
3. W-shaped attribution model
17.1% of Dreamdata users opted for the W-shaped attribution model, placing it as the third most used model of 2022.
2. First-touch attribution model
In second place was First-touch attribution with just over a quarter of users choosing it to run their reports.
1. Linear attribution model 🥇
Finally, in first place, was our Linear attribution model, which was selected as the attribution model of choice by 34.9% of Dreamdata users.
Are you wondering what attribution model is best for B2B marketers?
You might be interested in this video 👇


