
Nail your 2023 B2B Marketing Budget with these 3 metrics

Article updated Oct 2022
In this post, we’re showing you how recent customer journey data can help nail your marketing budget plan.
By looking back at the number of deals flowing through your pipeline, the velocity of your deals, marketing cost, and revenue generated, you’ll be able to accurately forecast your B2B marketing budget for 2023.
A little intro to budgeting with revenue data
Budget time isn’t everyone’s cup of tea. It forces marketers to take a step back from executing their campaigns and figure out what will be needed to hit the upcoming year’s goals.
Without infinite budgets to capture all those Marketing Qualified Leads (MQLs) by whatever means necessary, it falls on careful planning and budgeting to make sure your marketing efforts will actually hit your targets!
How many qualified leads will you have to generate? How many of these will become sales qualified? How long will it take? How much will I have to spend on which channels?
Fail to answer these questions yourself and you might have your CFO or CEO deciding your budget for next year - and that’s far from ideal.
Fortunately, with the right data at your fingertips, getting the right budget is easy as pie.
In this previous post, I covered how predicting your revenue using historical data can help tell you how many MQLs you need to smash your targets.
This post follows on from there to look into how your historical data can also be the key to your budgeting success.
We’ll show you how we answer the following three questions:
Leads: How many MQLs will you need to hit your revenue targets?
Timing: How long will it take to acquire these leads?
Budget: How much budget will you need to hit the revenue targets?
1. How many MQLs do you need to hit your revenue target?
The first question that any B2B marketing team needs to answer when forecasting their budget is: how much pipeline will we need to generate?
That is, how many MQLs need to be captured to hit the revenue targets that have been set?
Without linking MQLs to revenue, it’ll be virtually impossible to benchmark your budget forecast.
The good thing is that by looking at your historic revenue and pipeline data you can do this quite easily. This is how the marketing team at Dreamdata does it, and it’s worked well for us every time.
So, here is how to do it in five simple steps (with examples!)
Revenue target. Have a clear revenue target in place for a well defined time period.
Let’s say, for our example case, that we have a Q1 revenue target of $500,000 (ARR)
Define your historic data. Next is taking a look at your historic data. To make sure this is as accurate as possible, you need to choose a time period for the data you’re going to be looking at.
B2B customer journeys are notoriously long, so look at your time to revenue metric to make sure the period you're getting your data from is at least as long as the length of time for your average deal.
For our example case, we’ll look at our data from the previous quarter.
Your historic pipeline. Once you have your time parameters set, you need to find how many deals entered each stage of the pipeline.
That is, over the period how many MQLs were captured and how many of these made it to Sales Qualified Leads (SQLs) and closed-won.
From this, we’ll forecast the MQL-Closed Won conversion rate.
*It’s vital you have well-defined qualifications that suggest buying intent - at Dreamdata we use Free sign up or Demo requests*
Our historic data shows us that over the period we had:
400 MQLs → 50 SQLs → 20 NewBizzThis gives us the following stage conversion rates:
MQL to SQL conversion: 15%.
SQL to Won Deals conversion: 40%
MQL to Won Deals conversion: 5%
Revenue generated. Finally, find out how much revenue was actually generated over the period. This will set a benchmark average deal size for the forecast.
The revenue we generated over the period was $200,000 (ARR)
Which means that our average deal size was $10,000 (ARR)Calculate your MQL forecast. You can now reverse engineer this data to arrive at the number of MQLs you’ll need to hit the forecast.
You’ll have to divide your revenue target by the average deal size, to get the number of closed-won deals you’ll need. From your MQL to NewBiz conversion rate you can then calculate how many MQLs you need to hit the number of closed-won deals.
As our average deal size is $10,000, we know we’ll need 50 closed-won deals to hit our $500,000 Q1 target.
Now, we know that 5% of all MQLs became NewBiz.
So we can calculate that we’ll need 1,000 MQLs in Q1 to hit the revenue target.
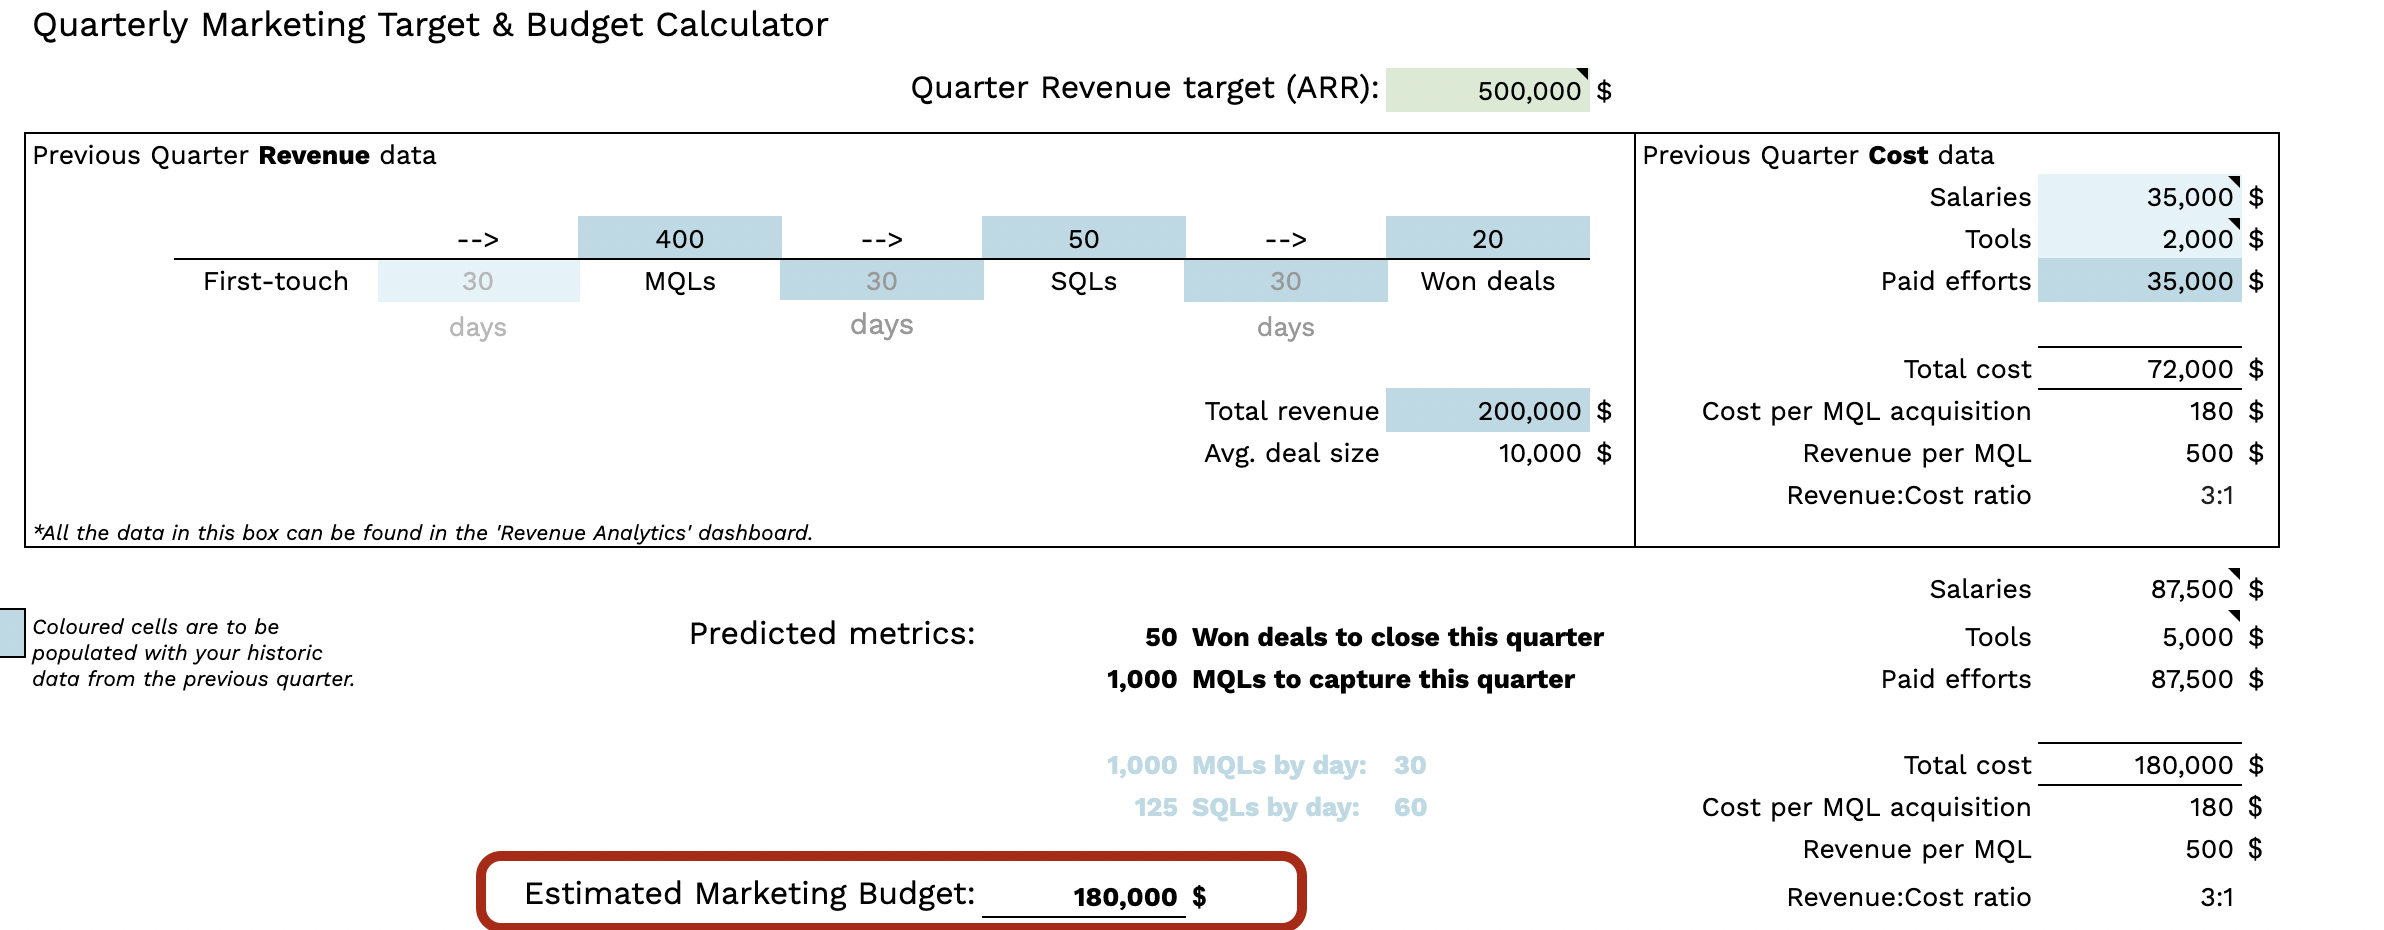
To make your life easier, you can plug in all these values into the first box of this template.

Now, this model only gives you half the story. While it sets your (well-qualified) MQL target, it says little about what you need to do to generate those numbers, and less so how much it’ll cost you.
Fortunately, your historic revenue and pipeline data hold the answer for this too.
2. How to meet the target in time?
The time factor, or velocity, is all too often overlooked in the forecasting process.
While finding how many MQLs you need to generate is essential, ignoring velocity risks missing your target.
In B2B, the account takes months to move down the pipeline. In fact, the according to this B2B go-to-market benchmarks report, the average B2B customer journey takes on average 192 days.
Which means that you cannot leave acquiring those MQLs till the end of the period; certainly not if you want to hit your revenue target (and allocate your budget appropriately).
Use Dreamdata’s performance attribution feature to optimize your marketing budget.
There are two time metrics you need to know:
How long it takes your MQLs to move to Close Won - This will set the cutoff point for your forecast.
The time it takes from first-touch to MQL - This will inform when your marketing investments and efforts should be activated.
Let’s continue our example to illustrate how we do it.
From our Dreamdata Revenue Analytics dashboard, we know that on average:
The 1st touch to MQL takes 30 days
MQL - SQL takes a further 30 days
SQL - Closed Won a further 30 days
This means that our investment needs to be frontloaded.
It tells us that the latest you can meet the MQL target for the quarter is by the end of the first month.
It further allows us to monitor whether or not we’re hitting stage benchmarks throughout the period, and therefore whether or not we’re on the right track to hit our targets.
Our template calculates these forecasts automatically for you.

So now we’ve got an idea of how many leads we need, and by when we need them if we’re to hit our revenue target.
To make sure you get the right budget, you need to know how much acquiring your MQLs by this time is going to cost?
3. Getting the right B2B marketing budget
Here we resort to the handy Cost per Acquisition metric. Specifically, we’re interested in identifying what the cost per acquisition is for your MQLs.
This will then allow us to forecast how much you’ll need to spend per MQL to hit your target.
Historic cost per acquisition
To identify the average cost of acquiring a customer we need to have a clear idea of what marketing costs are involved. This will typically reflect the parts of the B2B marketing budget you’re responsible for.
For instance, if you’re only controlling the performance (paid) marketing side of things, you’re only going to be factoring in this cost.
If you’re responsible for the whole marketing effort - content, paid, email, etc., including salaries and tool subscriptions - you’re going to want to be factoring in all these costs.
You might be interested in this article for all things Customer Acquisition Cost and how to reduce it wisely.
Cost of paid activities
Performance marketers, especially in the B2B world, are running campaigns across a multitude of channels.
Google Search, Display and Youtube ads, LinkedIn and Facebook ads, Capterra and G2 all at some point or other pass through the performance marketer’s portfolio.
The cost of all your paid activities - over the same sample period - needs to be factored into the B2B marketing budget. And to ensure as precise forecasts as possible, your costs data needs to be as accurate as possible.
Dreamdata facilitates this process by collecting data from all your paid channels. Dreamdata users can view this overview in the ‘Engagement - Cost’ dashboard.

Cost of Salaries and Martech subscriptions
If salaries and subscriptions are not under your responsibility you can move on to the next section. Otherwise, there are a couple of things to bear in mind here.
To point out the obvious, you need to make sure that you’re budgeting for the right period. For example, if you’re allocating your marketing budget for a quarter but your tool subscriptions are billed annually, make sure to split accordingly. Ditto for your salary.
On salaries, you also want to consider if and when you want that budget allocated, as well as how it might impact other parts of your budget.
Cost per acquisition
So, to find the Cost per Acquisition, we simply divide the total marketing cost by the number of MQLs we generated over the period.
In our example case, our total cost in the previous quarter was $72,000 and we know we had 400 MQLs. This means that our Cost per MQL Acquisition was $180.
Setting the B2B marketing budget
With your most recent Cost per Acquisition of MQLs in hand, you can accurately forecast what it will cost you to generate the MQLs for the budget you’re responsible for.
All you need to do is multiply the Cost per Acquisition by the target number of MQLs.
Let’s return to our example, to illustrate this:
Cost per MQL acquisition: $180
MQL target: 1,000 MQLs
Which means we’ll need a marketing budget of at least $180,000
By inserting your previous quarter costs on the top right of the template, you’ll get your estimated marketing budget calculated automatically.
The limitations
While it’s worked well for us at Dreamdata, there are some obvious limits to this budgeting exercise.
The biggest of these is the assumption that nothing will change over the forthcoming period.
That is, you’re forecasting based on the strategies you had in place over the last quarter.
Chances are that your strategies will change (even if slightly), especially if you’ve noticed some of your efforts not fully optimised.
A B2B revenue attribution platform helps identify what efforts are underperforming by giving you data-based insights into the performance of every channel, campaign and ad, against pipeline and revenue generated.
You can learn more about multi-channel attribution in this article. You can also check out our product videos to see how you can optimise your B2B marketing activities using Dreamdata.
Ideally, you want to be able to factor any strategic changes into your budget.
Optimise the channels that work best and budget accordingly
If you find, for example, that your organic activities are generating the best ROI and your Capterra ads are underperforming, you might want to hire a new content writer and scrap your Capterra campaigns.
You then need to adjust your budget accordingly. I.e. remove the cost of your Capterra ad spend from your total Paid Costs, and add the content writer salary.
For these changes, the benchmark Cost:Revenue ratio comes in handy - which you find in the template. Much more on this ratio here.
On the bottom right corner, the B2B marketing budget template gives you the chance to insert any new costs you’ll need to cover.
The 2023 B2B marketing budget template
Download template here
What to gain access to all your revenue data for your budget?