
How to predict your revenue and hit your targets with Dreamdata

Planning how to hit your revenue targets is easier when you can accurately predict your revenue.
In this post, we’re going to show you how we at Dreamdata use the Dreamdata platform to predict revenue and hit our targets.
Any marketer that’s been in the start-up scene long enough will know the feeling of having a revenue target thrown their way... especially following a funding round.
When the order comes in that “we need to hit $500k ARR this quarter”, the immediate “what do we need to do to get there?” thought crops into the B2B marketing team’s collective mind.
For us, historical forecasting - using historical data to predict our revenue - has proven a success every time.
That’s because accurate historical pipeline and revenue data offers invaluable insights into your past revenue generation. These insights can then be used to predict what you need to hit your revenue targets.
In this post, we’re going to show you how we use the Dreamdata platform to do just this.
We’re covering:
The 4 key ingredients for predicting revenue:
Time to Revenue
Number of deals in the pipeline
Average time in pipeline stages
Average deal size
The revenue prediction recipe
Pssst! We’re including a downloadable template
Four metrics: Four ingredients
Before starting to calculate your predicted revenue, you need to make sure you have access to the following Four metrics:
How long you take to generate revenue
The average time deals spend in each pipeline stage
The number of deals in the pipeline (by stage), and,
The revenue generated for the time period
As we show below, these form the basis of your predicted revenue.
How long does it take to generate revenue?
The first port of call is knowing how long your deals take to become a paying customer, i.e. your Time to Revenue.
This is because Time to Revenue sets the context for how long it takes you (on average) to generate revenue. From the very first touch of an account to when the deal is signed.
Without this parameter your revenue cycle and your forecasts will be misaligned, resulting in missed targets and misallocation of budget.
The bottom line is that you need to know your Time to Revenue.
And the only way to accurately measure it is if you collect data from the minute an anonymous user first engages with you to the minute the account becomes a client. Miss the first touch and you’re measuring from the wrong starting point - again misrepresenting how long it actually takes you to generate revenue.
A revenue attribution platform like Dreamdata collects and joins data from across the B2B go-to-market tech stack, to map the end-to-end customer journey.
You can find out more about Dreamdata’s data crunching here.
Already a Dreamdata user? You can find your Time to Revenue breakdown in the *Revenue Analytics* dashboard.

Find out more about Revenue Analytics here.
Why not see your Time to Revenue today?
Number of deals in your pipeline
Once you know the time period you’re going to be covering, you need to know how many deals there are at each stage of your pipeline.
In other words, between X date and Y date how many deals entered your pipeline as an Market Qualified Lead (MQL) and were closed-won.
These stats will enable you to find the ratio of leads to closed deals and so predict how many leads you need to close the target number of deals.
To achieve this, you need to make sure you have well-defined stages. The first stage in particular needs to be tangible enough to know that leads are actually showing intent.
For our attribution modelling, we split our pipeline into three stages: Marketing Qualified Lead (MQL), Sales Qualified Leads (SQL) and NewBiz. Where MQL is defined as a lead that has either signed up to Free or requested a Demo.
If you define MQL as simply any lead who has, say, clicked an ad or entered your website, this stage becomes too intangible. By which I mean, it is hard to tie the cohort of leads to closed-won deals. If this is the case it might be safer to rely on SQLs to NewBizz as the benchmark.
Average time deals spend in each pipeline stage
Once you’ve defined these you can track how long leads take to move from one stage to the next. How long deals spend at each stage in the pipeline enables us to predict how long it’s going to take to hit our targets.
Here’s a bit on Pipeline Velocity.
Dreamdata tracks your leads throughout their journey and breaks down your pipeline by defined stages. Helping you check, at-a-glance, how long deals are taking to move through your pipeline stages.
Revenue generated (+ average deal size)
When working towards a monetary target, like our example $500k ARR for the quarter, we need to know what our average deal size is.
This will be reverse engineered to find the number of deals you’ll need to close to achieve the revenue target and in turn how many MQLs you'll need to capture (by when).
So let’s get to it.
Predicting your revenue
Now that you’ve got all the ingredients, you can start the process of predicting revenue and smashing those targets.
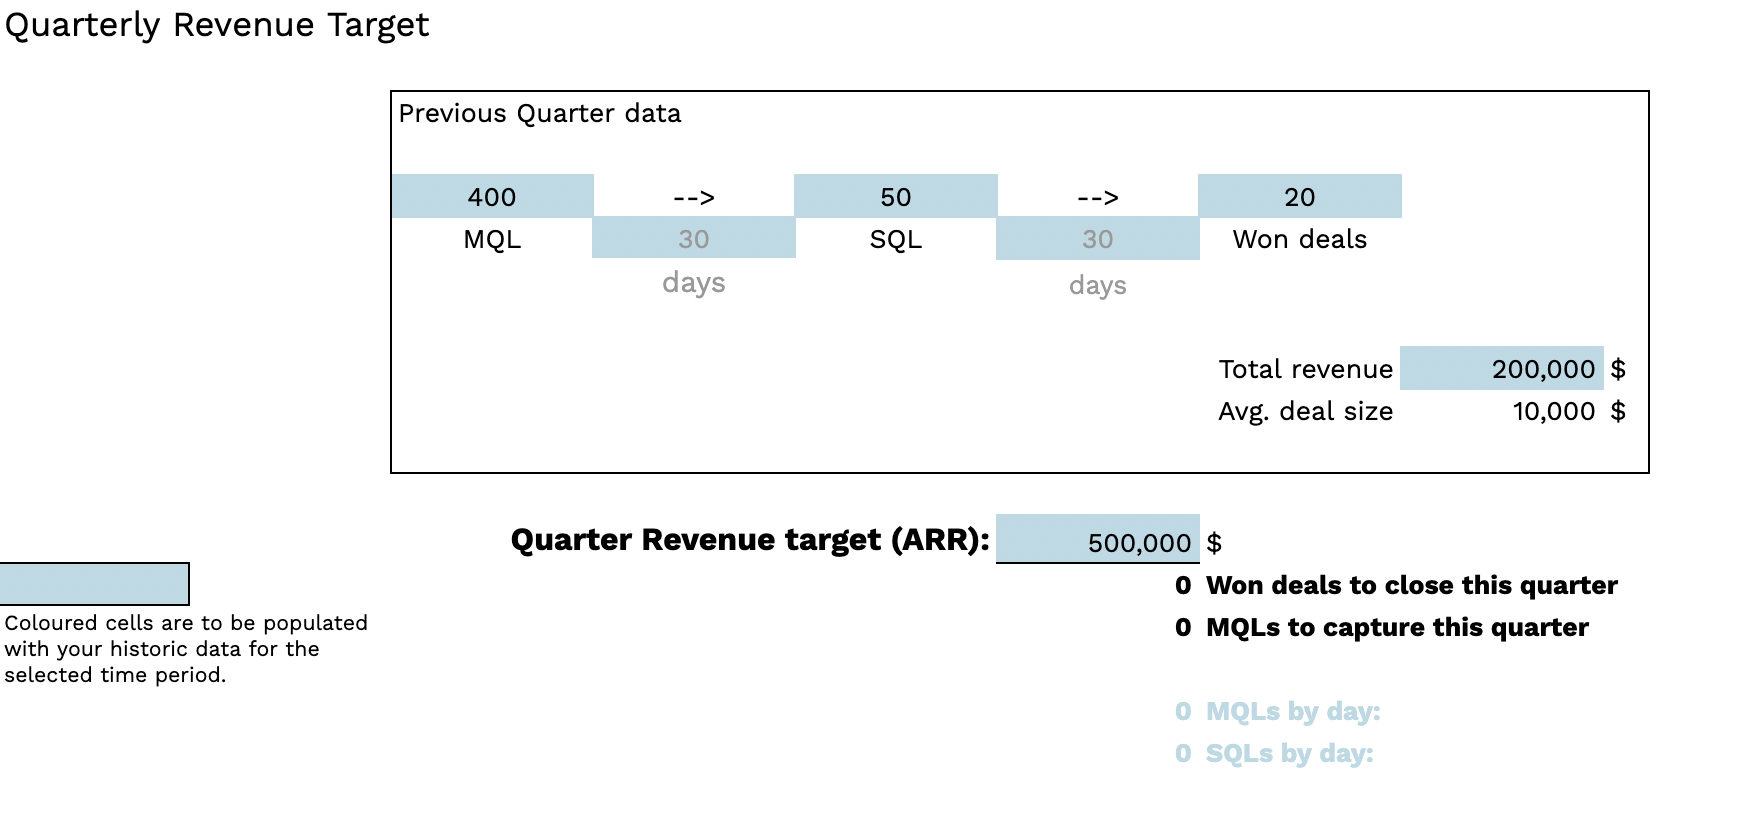
At Dreamdata, we plot the data from our platform into this simple template.
The starting point is, of course, our target revenue number.
In our example case, the CEO has asked for $500k ARR for Q1.

Let’s fill this in step-by-step.
From our Dreamdata revenue data, we have learned that it takes 60 days on average for an MQL to convert to closed.
But to ensure there is latitude for the extremes of the average (those deals which took longer) the time period we’re collecting data for is the latest 90 days, i.e. the last quarter.
This ensures that we take into account our most recent go-to-market strategies, and as such the most accurate forecast of what we can expect (as a minimum - more on this in Step 6) we’ll need to hit our target.
Step 1 - Number of deals in pipeline
The first part of the template we need to populate is the number of deals that went through the pipeline over the selected time period (the last 90 days).
From our data, we found that we had 400 MQLs, of which 50 became SQLs, and 20 won deals.

From this, we can see that over the period, the MQL to NewBizz conversion was 5%. Meaning that for every 100 MQLs we generated 5 would go on to become won deals.
Recall here how important it is to have well-defined MQLs (we are defining MQL as leads who started Free or requested a demo - see previous section)
Step 2 - Time between stages
Next is finding the average time it’s taken deals to move from one stage to the next. This will help us benchmark how many leads we’ll need and by when to hit our target (more on this in Step 5).
Our Dreamdata data tells us that it took an MQL 30 days to become an SQL and a further 30 days to become a won deal.

Step 3 - Revenue Generated
Now we move on to actual revenue generation. This is critical to knowing how you’re going to reach the $500k ARR target.
Our historic data shows us that we generated $200k ARR over the 90 days. Which gives us an average deal size of $10k.
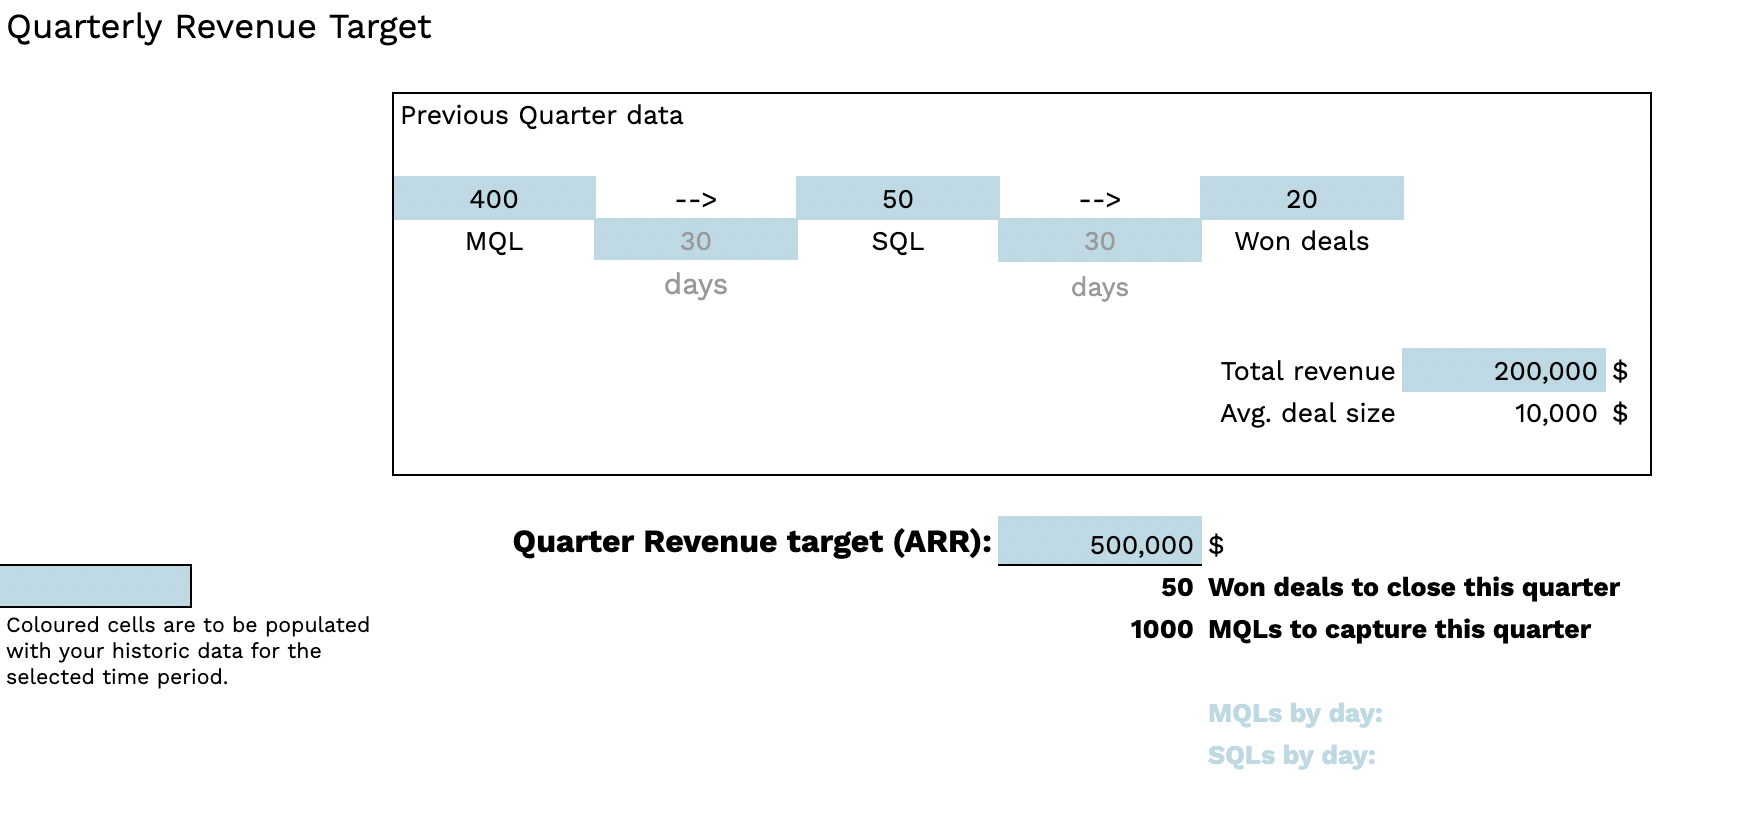
Step 4 - How many deals to close?
Now we’ve got all the ingredients to hone in on our target.
Based on our (most recent) historical data, we know that each deal is worth, on average, $10k. So, to achieve our target of $500k ARR, we need to close 50 deals in the quarter.
With this number, we can calculate how many MQLs we need to arrive there.
We know that 5% of our MQLs become won deals, which means that we’ll need to generate 1,000 MQLs to close 50 deals.
But we’re not quite ready yet…
As we know from our data, it takes on average 60 days to get a deal from MQL to closed-won. Which means that to hit our target we cannot wait to generate MQLs till the end of the quarter.
Step 5 - Hitting your target
Based on our average days in stage, our template can then show us the minimum number of MQLs (and SQLs) that need to have entered the pipeline by what point - if our target is to be hit.
We know there is a time delay of 60 days from MQL to close-won. Meaning that we need to have captured 1,000 MQLs within the 60 day limit if there is any hope of hitting the target of 50 won deals - and thus the $500k.

Step 6 - The caveats
The historical forecasting formula for predicting your revenue sets the minimum required for hitting your target. That is, the formula is based on historic data, and so assumes that nothing will change from then.
However, this is unrealistic.
Chances are that you’ll be optimising your demand gen and bringing in more MQLs, or improving the speed of your Sales conversions during the quarter. Which means that you can expect to surpass the target.
Speaking of optimising...
Download the Quarterly Target Template here
Only half of the story
This article has focused on only half of the story. While it has shown how data can be used to predict revenue generation to hit your target, it hasn’t looked at the cost and performance side of things.
Your historic data will also contain all the details on what it cost you to acquire those leads and ultimately generate that revenue.
Which means that when it comes to planning your budget for achieving these targets, you’re going to want to be taking a look at that.
Here’s our post on how to forecast and allocate your B2B marketing budget using revenue data. Watch this space!