
The B2B marketer’s guide for reducing Customer Acquisition Cost (CAC) wisely

This article was updated October 2024
Reducing Customer Acquisition Cost (CAC) is one of those marketing 101s that excites (and haunts) many a B2B marketer.
The KPI is a favourite with investors and c-suites for measuring marketing’s efficiency - after all, who doesn’t want to acquire customers as cheaply as possible? But how useful is CAC outside the boardroom?
In our guide, we‘re showing you how CAC can be a really valuable metric for the data-driven B2B marketer… if used wisely.
Intro to CAC as a marketing KPI
Calculating your Customer Acquisition Cost involves dividing the totality of your costs - think salaries and tech subscriptions as well as paid campaign costs - by the number of customers acquired over a period.
Shrink those costs, boost those customers and you’ve got yourself a winning recipe...
Only one problem though. Costs and the number of customers are (typically) inversely related. That is, to grow your customer base you need to spend more. And if your business is still in the early stages, growing your customer base is pretty important.
This shows how there’s a lot more nuance to CAC than slashing it to the bones come what may.
What should you cut? How might that affect future demand? Should you even be using CAC as a KPI? There are important questions that need to be addressed by the B2B marketer if they want to take CAC to its greatest potential.
And our guide does just this:

What is Customer Acquisition Cost (CAC)?
First thing first: definitions.
Customer Acquisition Cost is the average total cost of acquiring a customer. Or to put it another way, is the average cost of getting a customer to buy your product.
CAC Formula
To calculate your CAC you need to divide your total go-to-market spend by the number of customers you have acquired over the time period. So, the CAC Formula is:
CAC = Go-to-market spend on acquisition/ Number of customers.
Where the total go-to-market spend includes:
Marketing and sales salaries,
Ecosystem (tech subscription tools, e.g. CRM, automation tool)
Paid channels cost
So, for instance, if you have spent $100,000 on marketing and sales in a year and acquired 100 customers, your CAC for that year is $1,000.
Your calculation might look something like this 👇

Average Customer Acquisition Cost (Average CAC)
Average CAC gives an overall view of how much it costs, on average, to acquire a customer over a longer period. It smooths out the variations in monthly or quarterly CAC, helping to understand the typical cost of acquiring a customer.
The formula for Average CAC is:
Average CAC = Total go-to-market spend over a period / number of customer acquired in that period
When calculating your CAC or Average CAC, you need to bear in mind the length of your typical buyer journey - or time to revenue metric. For instance, calculating a monthly CAC only makes sense if your buyer journeys are shorter than 4 weeks. In B2B, you want to be looking at the yearly mark as most journeys span a number of months. More on this below.
Right, now you can calculate your Customer Acquisition, but how do you know what a ‘good’ CAC for your business is?
Customer Lifetime Value (CLV/ LTV)
For this, we need to turn to Customer Lifetime Value (referred to as CLV or LTV).
Often seen as the other side of the Customer Acquisition Cost coin, LTV helps contextualise your CAC by showing the revenue a customer generates in its engagement with your business.
Again here, we find another maths function to give us a helping hand; in this case a ratio with your CAC on the one hand and LTV on the other.
There’s a bunch of recommendations out there on the interweb about the ideal ratio. With the prevailing opinion being somewhere between 1:3 and 1:4. Although, the case has been made for a ratio of 1:5 for B2B SaaS.
At the high business level, the idea is for the CAC to be low enough against CLV to ensure, once all other overheads are added, profit margins are decent.
For the B2B marketer it shows that marketing dollars are not being thrown out the window with nothing to show for it.
Let’s dig deeper.
Why should B2B marketers care about Customer Acquisition Cost?
You might be asking yourself why CAC and not ROAS or channel ROI instead? And yes, those are incredibly useful metrics which we talk about here.
However, the beauty of CAC is in its encompassing the totality of go-to-market spend - including the salary costs of the teams and all the wider costs associated with selling your product.
This means that you can really dig into the costs involved in your activities and whether or not these are acquiring customers optimally.
As we show in our guide below, Customer Acquisition Cost can be used to optimise your marketing efforts: helping you identify what to scale, optimise or scrap altogether.
Planning your B2B Marketing Budget? You might be interested in this post.
Dreamdata’s performance analytics feature allows you to report on marketing spend and optimize your marketing efforts accordingly.
Learn what it takes to lower your CAC in this ebook
Customer Acquisition Cost: important consideration before you start reducing
However, as with any metric, there are some inherent limitations that need to be borne in mind. So before diving headlong into getting your CAC down let’s consider the main caveats:
Time to Revenue
Knowing when to limit your CAC calculation is vital to using it effectively.
Cut the time too short and you’re not capturing the efforts that acquired the customers. Stretch the time too long, and you won’t be able to detect changes in strategy and/or organisation. Meaning CAC stops being relevant.
Ideally, as the guide below shows, you want to have up-to-date Time to Revenue metric at your fingertips. This will ensure you’re always able to calculate your Customer Acquisition Cost as accurately as possible.
Customer diversity
As an average, the Customer Acquisition Cost metric doesn’t do justice to the inherent differences between your customers. Some customers may be more valuable than others, and as such could/should (in theory) have a higher CAC.
Cutting certain channels for having high CAC may adversely impact on revenue, as it might be these channels which are driving high-revenue customers.
So when it comes to optimising activities by using CAC as a benchmark, it’s vital you include LTV. Only then can revenue be factored in.
Further still, you might want to break your customer base into segments, to understand the CAC vs LTV of each segment. In this way, you get a better idea of the acquisition cost of your different segments, and even, which are worth doubling down on.
This also means that CAC:LTV (above) can be used to help narrow down on your ICP. See more on how data can be used to build your ICP in this post.
Growth mode: on or off?

Where you are in your growth journey is also a big factor in how much attention should be paid to CAC. In early stages of high growth, profit margins are much less a concern than demand gen, brand building, etc.
Spend too little on your efforts and you might lower your CAC, but your growth might be looking a little slim too.
Remember CAC has two components: Cost and No. Customers. To increase the second quickly, you’ll want to be spending more. Which means that for businesses in ‘growth mode’, a high CAC now will mean higher demand and a lower CAC down the line.
For these businesses, scalability is of much greater importance than cost reduction. So you need to be asking yourself, is what you’re doing scalable, yes or no?
CAC, the headline metric, is not suited for answering this. For all intents and purposes, CAC is a crude measure which doesn’t distinguish between the type of go-to-market spend and its intended effect.
For example, you might be running a SEO process which you know will not yield results immediately, yet the cost is put into the mix.
CAC/LTV by channel however, is much more useful to the growth-focused B2B performance marketer.

Data matters. A lot
HOWEVER - and it’s a big however - at channel level, you won’t be going very far without data (and attribution).
For any deepdive into your channels and what impact they are having (or not) on the buyer journey, you need data from across said journey.
In B2B this is especially problematic. B2B customer journeys are long and involve multiple stakeholders. Which makes tracking a little harder to achieve - at least without the right tools.
So in order to use CAC(/LTV) to its greatest potential, you need to have: (1) good tracking in place; (2) data from your tech stack joined and in one place; and (3) B2B-specific attribution modelling.
With this in place, CAC can be a pretty powerful metric. Here’s our guide for reducing it wisely 👇
The B2B marketer’s guide to reducing CAC wisely using Dreamdata
Step 1 - Find out how long your customer journey is
Before taking any steps towards calculating your CAC, you need to figure out the average time it takes from first touch to when you close your deal - aka your time to revenue.
Once we know that the average journey takes 292.1 days from the first touch to closed won, we can set a minimum time limit on our CAC calculation.
Ideally, you want to add a month or two to the time limit as the campaigns which likely acquired the first touch were being run before the acquisition.
So in the case above, you want to be limiting your calculation to a minimum of 12 months.
NOTE:
The advantage of keeping close to this minimum time limit is that you get a better sense of how your current activities are performing (in terms of CAC).
The disadvantage is missing out on previous data, especially recurrent revenue (for LTV).
Measuring the Time to Revenue metric has a multitude of uses, see more on B2B time to revenue here and here.
Dreamdata collects data from across your go-to-market tech stack, which means that the platform accurately measures how long it takes from your customer’s first touch to closed won and beyond.
Dreamdata also breaks down the time to revenue metric by stage.

Step 2 - Know your CAC/LTV ratio
Once you’ve set a time limit, you can start calculating both your CAC and LTV.
For the purpose of this scenario, we’re going to fix it to 1 year.
So to calculate our CAC you’ll need all of your go-to-market expenses over the year. 👇

You can find the total cost of your paid activities for the period in the Dreamdata “Paid/Cost” dashboard and the number of closed deals in “Revenue dashboard” - shown in the next step below
From our Dreamdata dashboards we know that there were 97 deals closed in the period, which means the CAC is $19,021.
($1,845,000/97)
Now we need to get our customer LTV for the period. Which in this case is easy, as our pricing runs on an annual basis. Meaning that we can use the average deal size for the period: $92,548
Giving us a CAC to LTV ratio of 1:5 (1:4.8 to be precise).
If you are wanting to calculate your customer LTV for a longer period, I recommend taking a look at this LTV calculator from HubSpot.
As far as headline figures go, this CAC/LTV ratio is pretty good. Meaning that we needn’t pay too much attention to bringing it down. Much the opposite, as a “growth” business, it means greater investment needs to be made on acquiring more (valuable) customers.
And CAC can help us identify where to scale.
Step 3 - CAC/LTV by customer Segments
Getting a rough gauge on your CAC/LTV on each of your (deal size) segments means you can assess which should be doubled down on to push up that LTV.

In the above example, we see that deals worth < $30,000 generate 3% of revenue, yet account for 27% of deals. Using our average CAC ($19,021) we see that the ratio here is 1 : 1.5 - and that is assuming all of these are $30,000.
Which means that time, effort and cost is being spent on low-value deals.
Granted, this might be an unfair comparison, as it is likely the lower value deals involve lower acquisition costs.
But even if this is the case, low CAC to low LTV can be worse than high CAC to high LTV. Given all overheads are the same, $2,000 CAC to $8,000 LTV for 10 customers is worse than $20,000 to $80,000 for the same number of customers.
This segmentation’s shortcoming is clearly the inability to see exactly what costs are involved for each segment.
For more clarity at the account level, Dreamdata offers users a customer journey map for every one of their accounts. Where you can see who interacted with your business and when.

This feature (coupled with segmentation) is particularly useful for running ABM campaigns and hitting a desirable CAC/LTV on each. Want to kick start ABM? Check out our 4 ways to fire up your ABM post.
But to really squeeze out the best of CAC, you need to break down CAC by channels. And humility aside, this is where Dreamdata really comes into its own.
Step 4 - Find the CAC of your main channels
CAC by channel is perhaps the most useful measure for the B2B marketer. CAC lets you see which channel is delivering customers more efficiently so you can choose where to invest and scale your marketing resources.
Let’s return to our example case. Recall that our headline CAC/LTV ratio offered room for greater investment in acquisition, i.e. add to our cost.
With Dreamdata we can find which channels have produced the best CAC/LTV ratio.
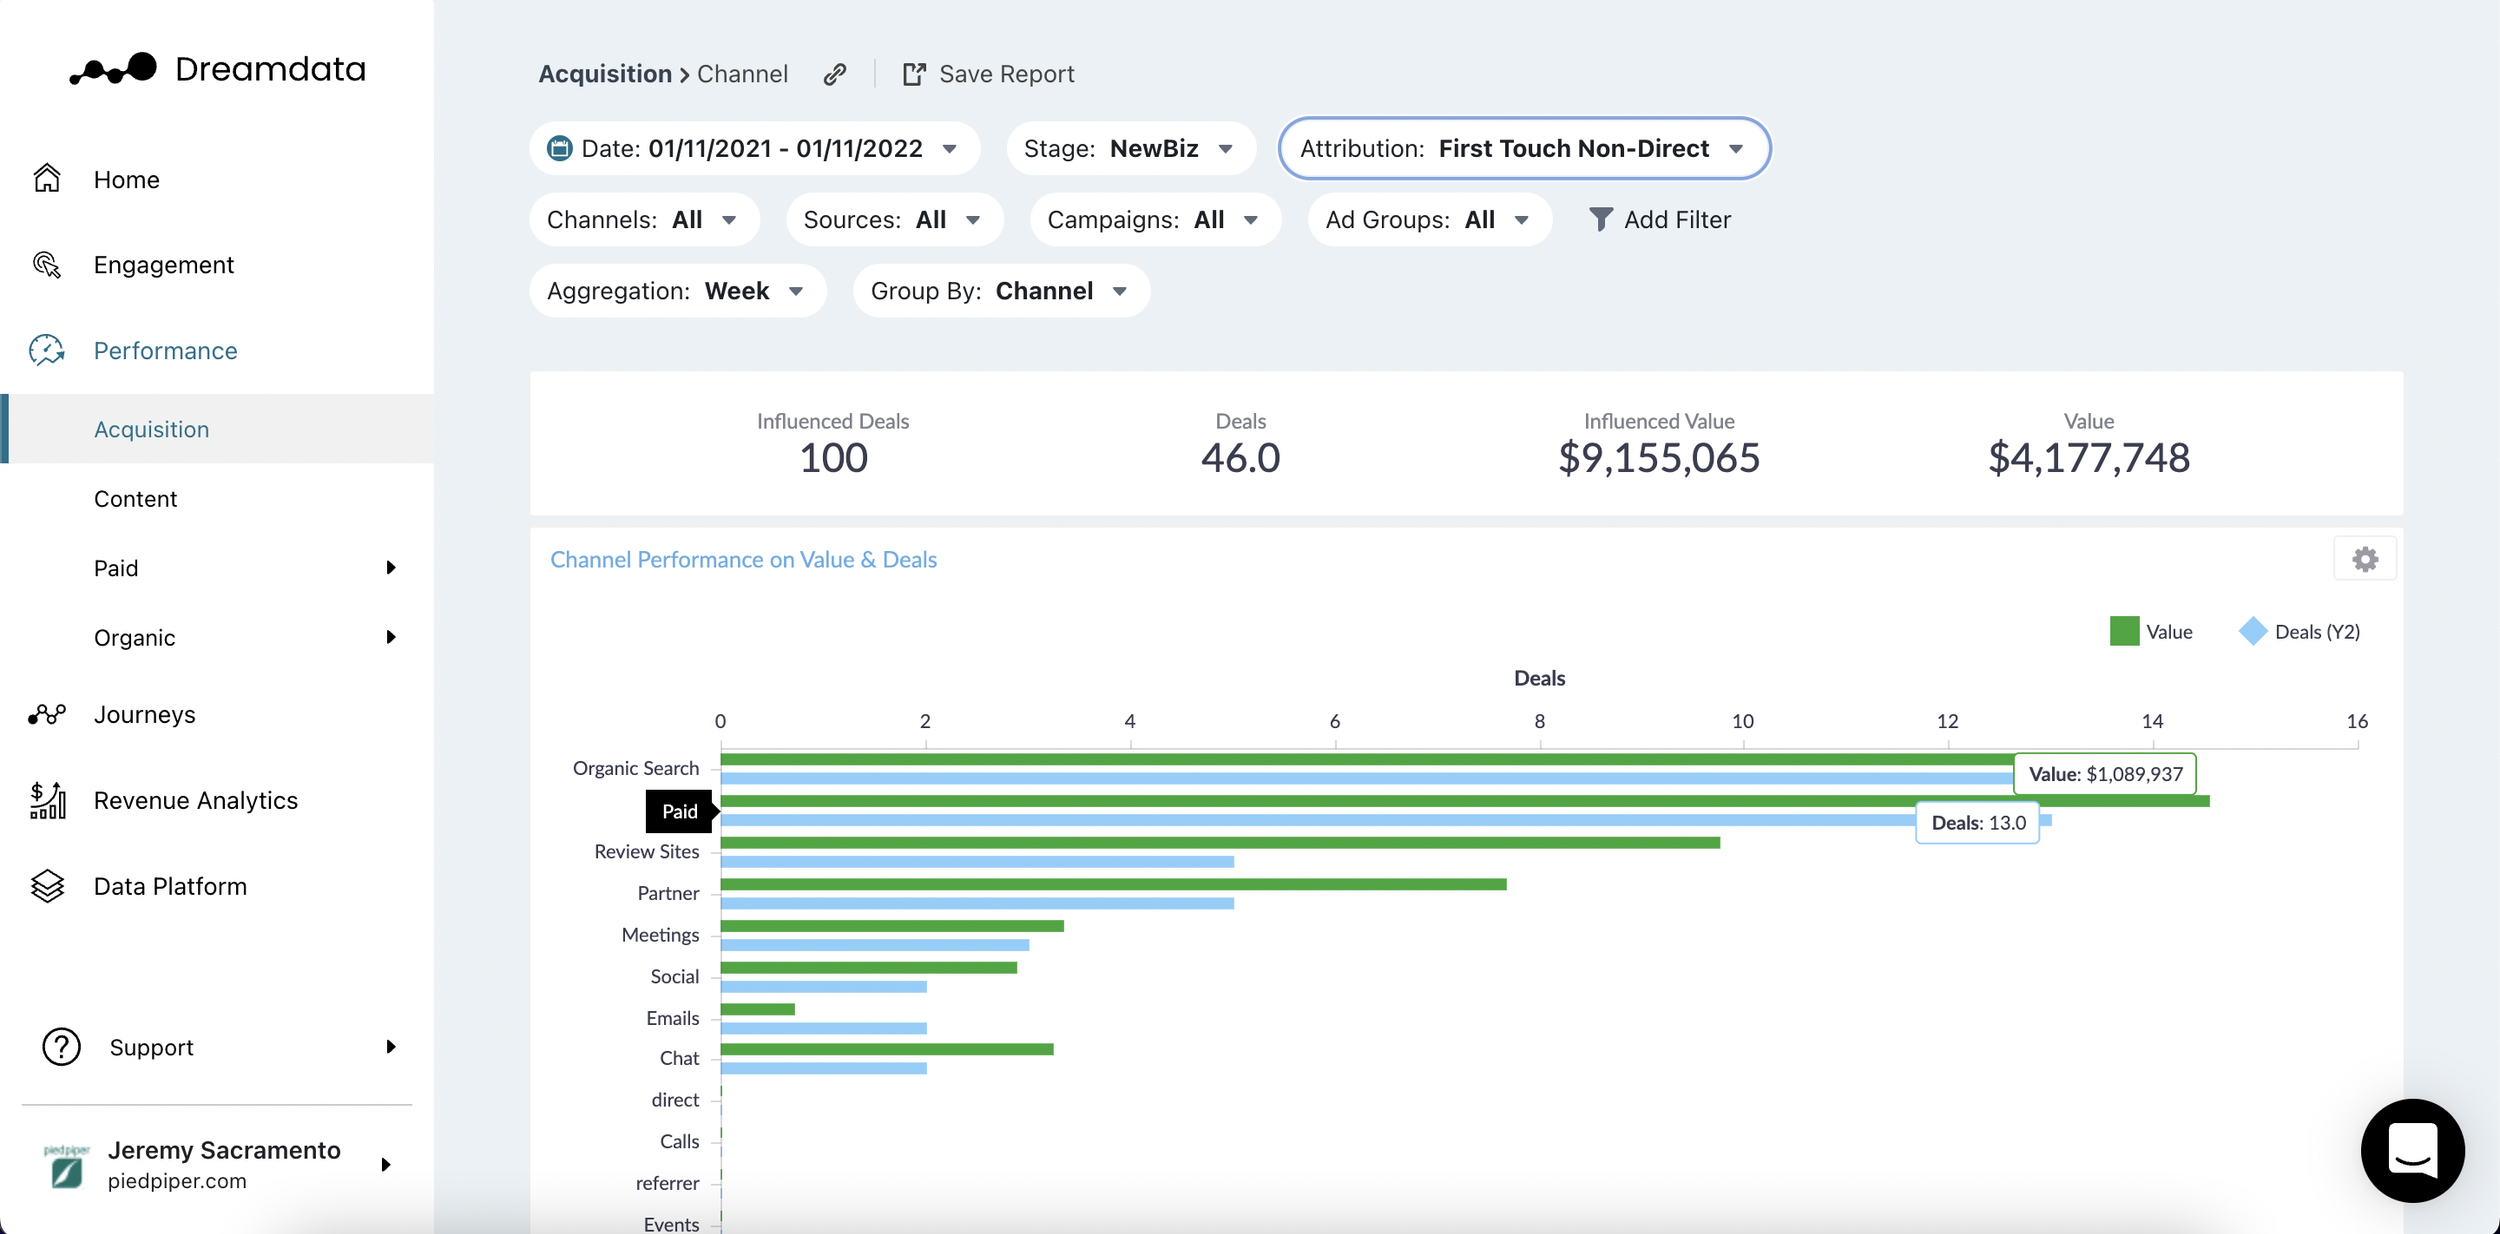
In this scenario we see that, as a first touch in the journey, Paid campaigns generate the greatest revenue and 13 deals. For an average deal size of $83,841.
To find the CAC we need to then allocate all the relevant Paid resources, i.e. costs. This includes:
The salary(ies) of whoever is involved in Paid marketing - if someone has split tasks, split the salary accordingly.
The cost of any tools involved in the Paid process, and
The cost of all paid campaigns.
In our scenario, we have a single paid marketing specialist earning $60,000, plus an agency costing $100,000 a year. Added to this, the total cost of all paid campaigns is $295,001.

$455,001/13 deals give us a CAC of $35,000
Higher than our headline CAC.
The CAC/LTV ratio is 1:2.6 here. Which suggests room for economising this channel.
Curious about channels? You might be interested in this post on multi-channel attribution.
With this in hand, you can deep dive into your Paid channels and campaigns using Dreamdata’s dashboards.

Check out our Dreamdata recipe Cutting cost on your Google Ads with Dreamdata here —>
The great thing about CAC is that you can then compare CACs before and after the introduction of new strategies to assess how effective your optimisation has been.
CAC. A summary.
So in summary, CAC reduction as a KPI can be immensely useful for the B2B marketer… so long as you take the following into account:
1) CAC is only as useful as customer LTV. LTV offers the context for ‘good’ or ‘bad’ CAC.
2) If you’re an early-stage business on a high-growth journey, high CAC today can be a good thing. It means more investment in growing the customer base which will bring down your CAC in the future.
So for growth-mode B2Bs high CAC today means low CAC tomorrow.
3) Calculate your CAC(/LTV) on your segments, to know who to focus on - and sharpen your ICP.
4) CAC is most effective for the B2B marketer at the channel level. Find the CAC for your channels and optimise accordingly.
5) You need to have the right data at your disposal. No data, no reducing CAC (wisely). It’s that simple.
Why not get on top of your CAC with Dreamdata?
Customer Acquisition Cost FAQs
Question: How do I calculate my Customer Acquisition Cost?
Answer: Customer Acquisition Cost = Total spend on acquisition/ Number of customers over a period.
Read more here —>
Question: How to lower customer acquisition cost?
Answer:
1) Make sure you’re tracking and measuring your customer journeys to know how long to set your time span in your CAC calculation.
2) Cut only the channels, campaigns, etc. that are not impacting revenue and pipeline. i.e. you need to be able to measure impact on pipeline and revenue generation (which is why 1. tracking your customer journey is also important).
3) Tie your CAC goals to your business and growth journey.
4) Use your CAC/LTV (see article above) as a barometer to know whether you need to reduce your CAC.
Find out more on how to lower your CAC here —>
Question: What’s the difference between Cost per Acquisition (CPA) and Customer Acquisition Cost (CAC)?
Answer: Cost per Acquisition (CPA) refers to the campaign cost of acquiring Leads/ conversions . Customer Acquisition Cost (CAC), on the other hand, refers to the totality of costs on a closed-won customer.