
Your non-branded Google Search Ads are getting better at attracting clicks. Great news, right?
Well, Google has other ideas.
Last year, our B2B Google Search Ads benchmarks painted a pretty bleak picture: click-through rates fell and costs rose. This year, CTR bounced back, but costs kept climbing. That raises a question: if B2B marketers are doing a better job of attracting clicks, why does Google keep getting more expensive?
To find out, we compared January - September 2026 with the same period in 2025, using the Ad Performance and Ad Budget reports in Dreamdata’s B2B Benchmarks.
In this blog, you can find out what’s happening, what might be driving the costs up, and how you can approach your non-branded search budget in 2027.
TL;DR:
Click-Through Rate (CTR) increased 7% to a median of 4.49%.
Cost-Per-Click (CPC) rose 25% to a median of $7.51.
Cost-Per-Mille (CPM) climbed 29% to a median of $335.
Non-branded search’s share of B2B ad budgets is falling (so where is it going?)
The State of Non-Branded Google Search Ads in 2026
Non-branded search is where you meet buyers who haven’t heard of your brand yet. For most B2B teams, those generic keywords still take one of the biggest slices of ad budget.
Last year’s benchmarks showed falling click-through rates (CTR) as well as rising costs-per-click (CPC). Fewer people clicked and each of those clicks cost us more.
This year though, one of those has pulled a U-turn: CTR has recovered (was it our creatives? Our copy?), while costs have continued to climb.
Click-Through Rates Are Recovering
The median CTR for non-branded Google Search Ads increased by 7%, from 4.19% to 4.49%.
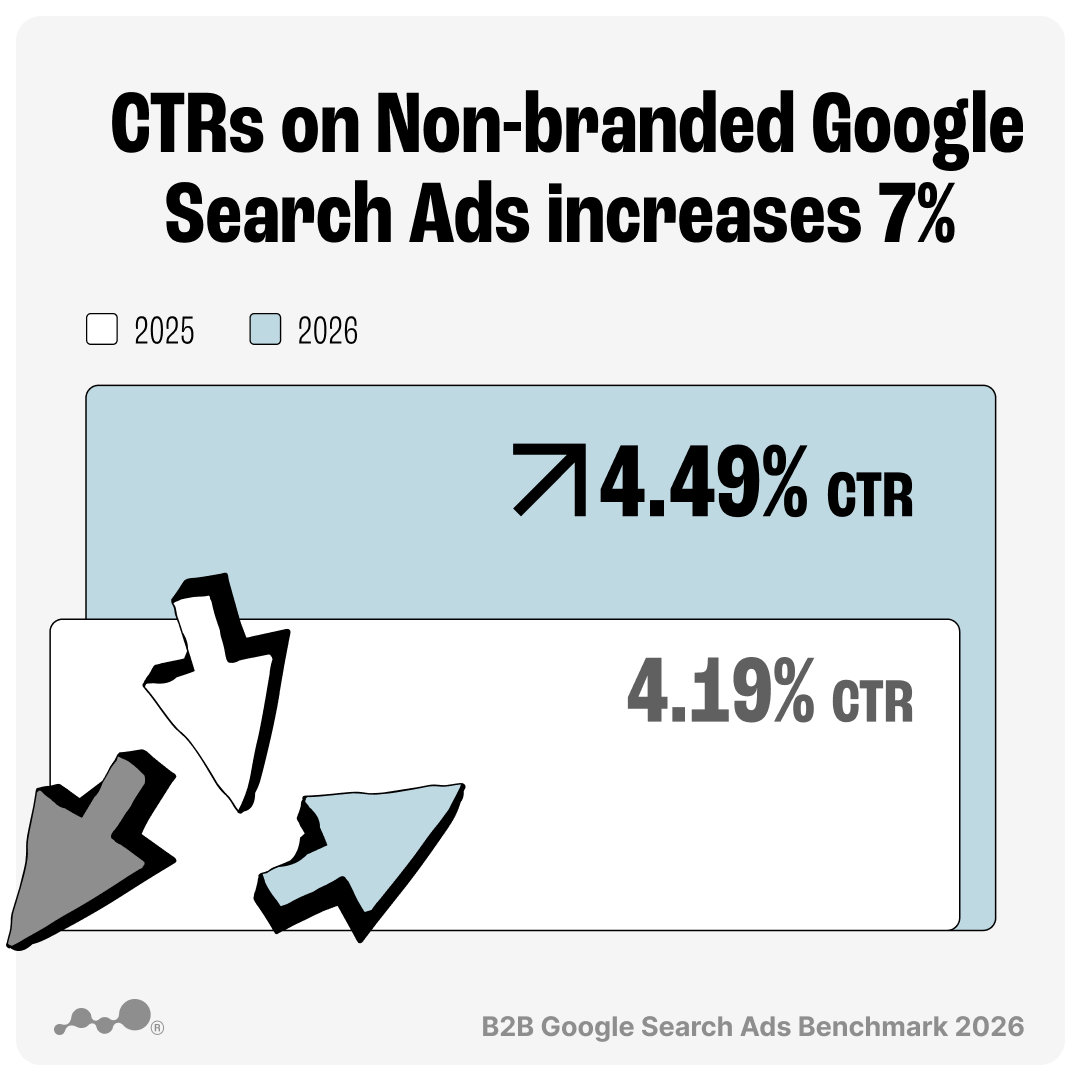
And CTR was higher year over year in every month from February through September 2026. By September, it was 17% higher than the same month in 2025.
The recovery suggests that ads are doing a better job of attracting clicks from the people seeing them. If you acted on last year’s advice by tightening ad copy and adding sitelinks and callouts, that work may well be showing up here.
Clicks Cost More, But So Does Showing Up
Higher CTRs should’ve taken some pressure off CPCs… but they didn’t.
The median CPC increased by 25%, from $6.00 to $7.51. That’s an additional $1.51 for every click, even as a greater share of impressions turned into clicks. And CPC was higher in every month of 2026 compared with the same month in 2025.
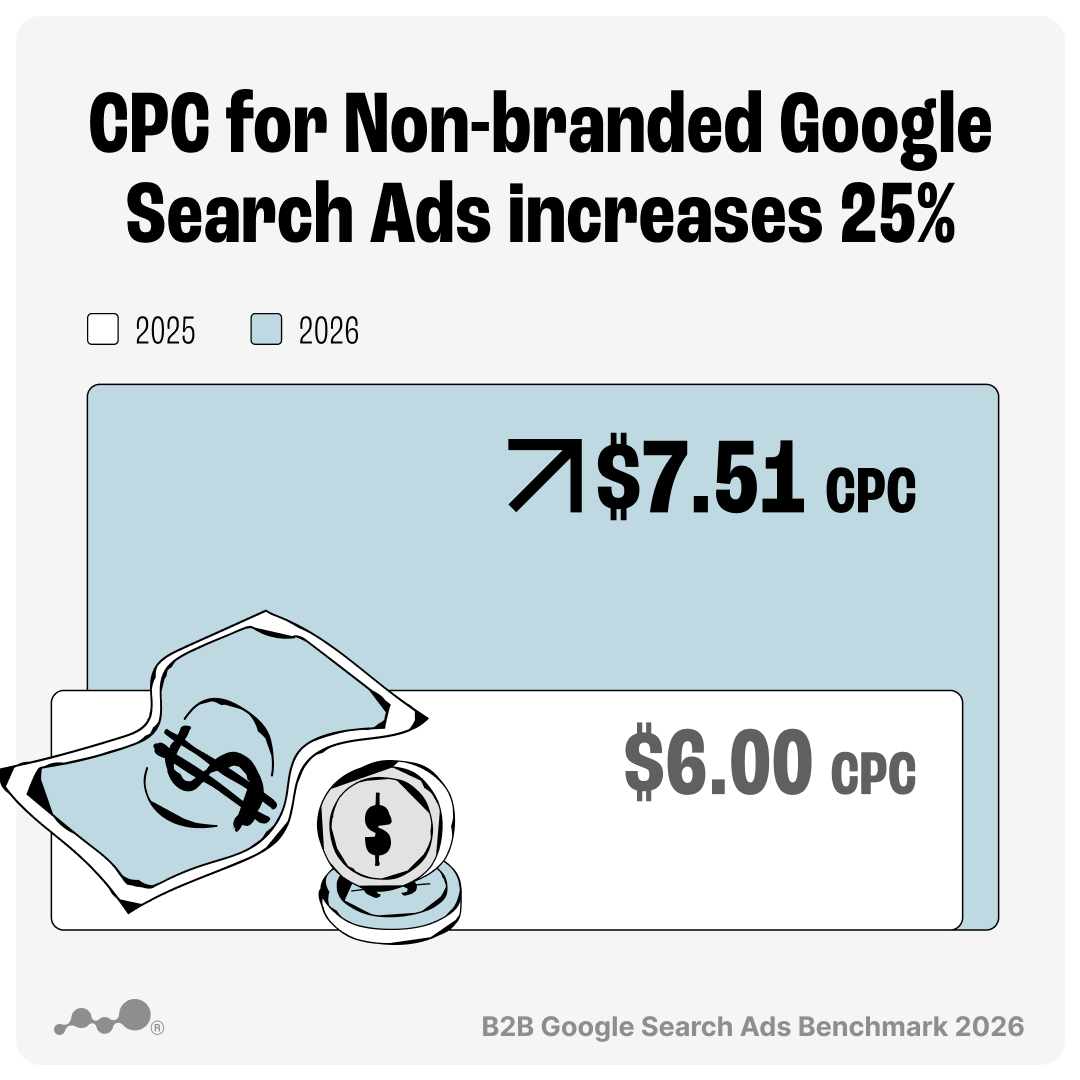
The reason likely sits one step earlier in the auction. The median cost-per-mille (CPM) rose 29%, from $260 to $335. Put the two side by side: while more people are clicking on non-branded search ads, the cost of getting those ads in front of buyers has risen even faster.
Non-Branded Search Is Losing Budget Share
As costs rise, non-branded Google Search is taking up a smaller share of B2B marketing budgets. Its share fell from 38.2% in 2025 to 34.2% in 2026.
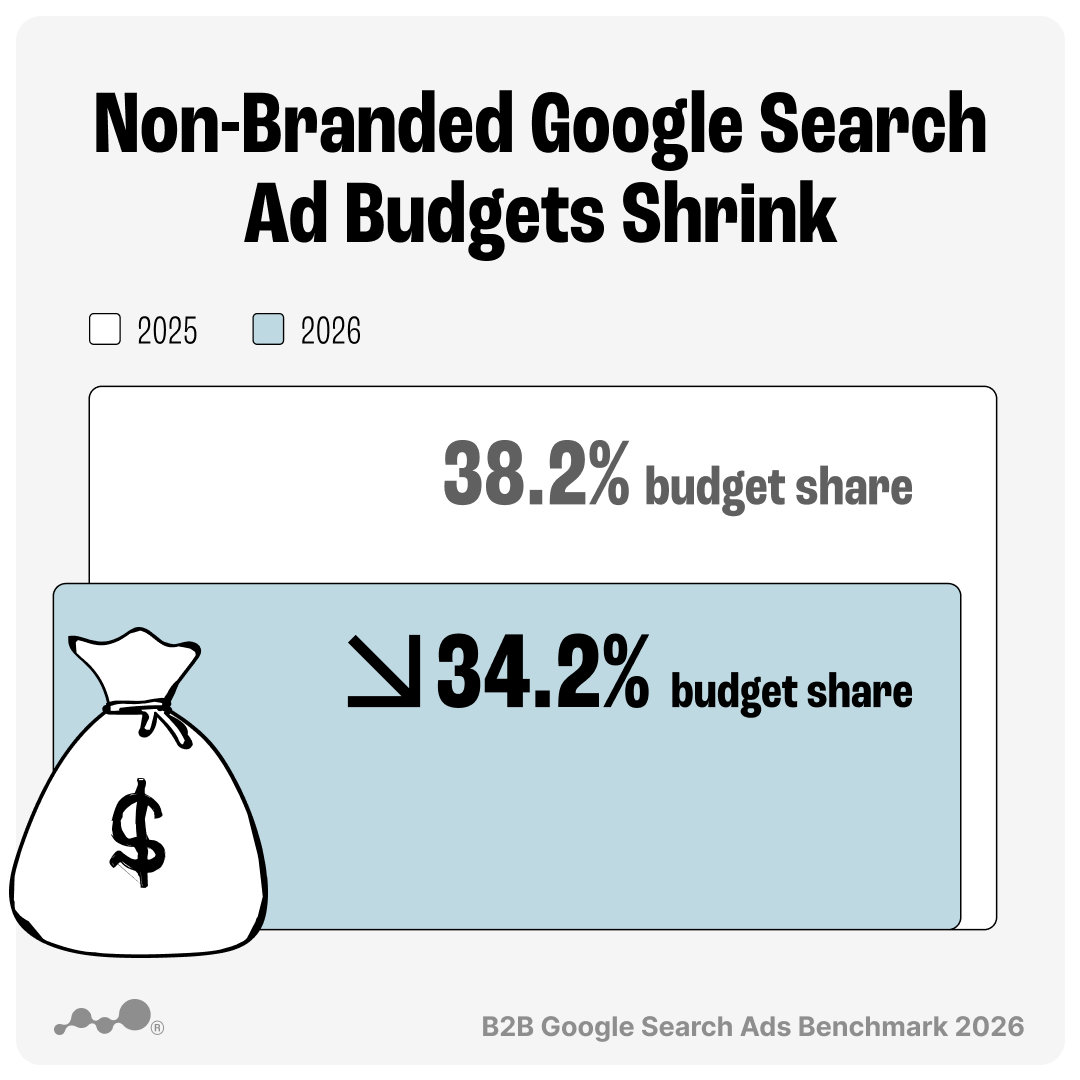
It’s more telling than it looks. With CPCs up 25%, simply buying the same number of clicks would have pushed search’s share of budget up. It fell instead, which suggests that B2B marketers are buying fewer non-branded clicks and prioritizing other channels.
Non-branded search still has a place in the mix. It captures buyers who are actively looking for solutions, but the economics are getting harder to ignore.
What’s Driving the Cost of Non-Branded Google Search Ads Up?
Last year, we pointed to falling CTRs as one possible explanation for rising CPCs.
Google’s Quality Score takes expected CTR into account, so ads that attract fewer clicks can end up paying more for the same visibility. We also pointed to AI Overviews, generic ad copy, and missing ad extensions as possible contributors.
This year’s numbers complicate that.
CTRs have recovered, but CPCs still rose 25%. You’re getting more clicks for every impression and paying significantly more for each one.
And CPCs increased by 25-30% on every cost tier (from the cheapest to the most expensive clicks), meaning even marketers paying relatively little per click are still seeing their costs rise.
We’re not Google, so we can’t pinpoint the exact cause. But we have a few theories:
More competition in the auction
We admit, this one's a bit obvious. Non-branded keywords put marketers in front of buyers who are actively searching for solutions. Competing for those same searches means the price of appearing in front of your buyers can rise.
Automated bidding
Google’s bidding algorithms adjust bids based on how likely a click is to produce the outcome a marketer wants. As marketers rely more on automated bidding, it’s possible that bids are becoming even more aggressive for valuable searches.
Automated bidding can still work well for your account. But when everyone’s algorithms chase the same high-value searches, prices rise for all of us.
Fewer available ad placements
Do you scroll past Google’s AI Overview to find what you’re looking for, or skim it and get the gist? AI Overviews are changing how people interact with search results. And if they leave less room for ads on certain searches, we could face more competition for the remaining slots.
Either way, a better CTR alone may no longer be enough to keep costs down.
And, on top of that, it looks like B2B marketers are putting their money elsewhere. Our data shows that branded search has held steady at around 9% of spend, while LinkedIn and Meta have each gained 1-2 percentage points of budget share.
CPCs on both LinkedIn and Meta dipped slightly over the same period, suggesting that marketers are deliberately buying more of them.
That makes sense. Non-branded search remains valuable for reaching buyers who are actively researching, but when the cost of reaching them keeps increasing, it’s worth asking how much of your budget the channel still deserves.
How Should B2B Marketers Respond in 2027?
Unless Google starts handing out discounts, it’s probably worth preparing for another expensive year of non-branded search.
Plan Your 2027 Search Budget for Higher Prices
At this year’s prices, the same non-branded search budget buys you roughly 20% fewer clicks.
If you’re planning to spend the same amount next year, you have two options: 1) raise your budget to keep click volume, or 2) accept that your existing budget will bring in fewer clicks.
Either can be the right call, but it’s worth making it a deliberate choice. No one likes a surprise right before the Q2 budget review.
Judge Non-Branded Search on Pipeline Rather Than Clicks
This year’s benchmarks show why engagement metrics only tell part of the story. Look at your cost per opportunity and the pipeline generated, then compare those numbers with your other ad channels.
If non-branded search is still bringing in relevant opportunities, the higher CPCs may be worth paying. If another channel is generating more pipeline for the same spend, you might want to shift budget somewhere else.
Waste Costs More Now
With CPM up 29% and CPC up 25%, irrelevant searches cost more than they did last year.
Try reviewing search terms and adding negative keywords to exclude searches that aren’t relevant. You can also tighten your match types if you can see you’re paying for traffic that’s too far removed from what you sell.
It’s also worth checking for overlap between your Search and Performance Max campaigns, so you’re clear on which searches each campaign covers and where your budget is being spent.
We can’t control Google’s prices. But we can control which searches we’re willing to pay for.
Final Thoughts
The good news? Non-branded Google Search Ads are earning more clicks again! The bad news? Google is charging considerably more for those clicks.
It’s time to act on what you can control:
Plan your 2027 search budget around higher CPCs
Measure cost per opportunity and pipeline, rather than clicks alone
Cut wasted spend with negative keywords and clear campaign targeting
Compare non-branded search with other channels to see where your budget delivers the most value
About the Data
The data used to compile these insights is anonymised, aggregated data* from Dreamdata customers who have integrated Google Ads with Dreamdata (and who have not opted out of the Benchmarks).
The data compares monthly medians from January - September 2026 with January - September 2025. Cost tiers compare full-year 2025 with January - September 2026. Non-branded search budget share comes from Dreamdata’s Ad Budget benchmark, which uses averages across accounts.
All figures were converted from EUR at a fixed rate of $1.14 per €1 (ECB average for the time period used). Figures reflect the current benchmark group and may differ from those in last year’s blog.
* At Dreamdata, we take data security and privacy very seriously. Dreamdata has processed only non-PII data for this study. The data insights are aggregated, and a minimum number of data points (accounts) has been introduced for every benchmark meaning it is not possible to identify individual companies. Only data from companies that have agreed to let us use data in benchmarks are included.
